Industrial washing / Articles
Mean Time Between Failures: what it reveals about the reliability of your equipment
Discover how Mean Time Between Failures (MTBF) reveals hidden reliability issues and improves uptime in industrial operations.
 7 minutes of reading
2025-12-10 17:50:58
Mean Time Between Failures (or MTBF) is arguably among the most important maintenance KPIs. It reveals how robust your processes are, if you’re doing enough to prevent machine breakdown and where to focus continuous improvement efforts. And it can save you a lot of time and money – if you know how to measure it right, that is.
Discover what MTBF really reveals about your workflow and why tracking it systematically lets you extend equipment life and prevent costly disruptions.
What is Mean Time Between Failures?
Mean Time Between Failures (MTBF) is the average amount of time a piece of equipment operates before it experiences a failure.
In simple terms, it’s a reliability indicator:
- A higher MTBF means equipment tends to run longer without interruption.
- A lower MTBF suggests more frequent breakdowns and potentially higher maintenance costs.
MTBF gives you a practical way to understand how stable, predictable, and cost-effective your operations truly are. Imagine you have a conveyor motor that failed 4 times over a 2,000-hour observation period. To calculate MTBF, you’d simply divide your total operating time (2,000 hours) by the number number of failures (4) to reach an MTBF of 500 hours.
This means that, on average, this motor runs 500 hours between each failure. If your target MTBF is 800 hours, this result tells you the asset is underperforming and may need a redesign, better preventive maintenance, or higher-quality parts.
How to calculate Mean Time Between Failures
Here’s a simple and reliable formula you can apply right away:
MTBF = Total operating time / Number of failures
Put plainly: add up how long the equipment (or fleet of identical machines) actually ran, then divide by how many times it failed in that period. The result is usually expressed in hours.
However, it is important to follow a few ground rules to make the KPI truly useful.
- Decide the scope. Are you measuring one machine, a fleet of identical machines, or a specific subsystem?
- Define a “failure”. Agree what counts as a failure: a stoppage that requires correction or replacement, not an operator reset or planned shutdown. Document that definition.
- Record operating time carefully. Operating time is cumulative up-time between failures. Use timestamps (start/stop) from PLCs (Programmable Logic Controllers), SCADA (Supervisory Control and Data Acquisition) or maintenance logs. Exclude planned downtime.
Why calculating Mean Time Between Failures actually matters
Mean Time Between Failures helps you run an operation with better financial control. When you calculate it consistently, you unlock advantages that go far beyond engineering charts.
1. A clearer picture of your real reliability
Most teams operate on gut feeling: “that machine is getting old”, “it’s been stopping more often.” Mean Time Between Failures replaces that with evidence. It quantifies reliability in a way that everyone (from maintenance to finance) can interpret the same way.
2. Better planning
Knowing the average interval between failures lets you anticipate when the next interruption is likely. It turns reactive chaos into predictable maintenance windows: you schedule washing cycles, lubrication, parts replacement and inspections before breakdowns cascade into downtime.
3. Smarter Opex vs. Capex decisions
Mean Time Between Failures exposes the true cost of keeping a machine running as long as possible. If the interval between failures drops steeply, the case for replacement becomes clearer. If reliability stays stable, you avoid premature investment. In both cases, Mean Time Between Failures brings facts into budget discussions.
Common mistakes with Mean Time Between Failures
Spotting these pitfalls is the first step to turn MTBF into a real advantage.
1. Treating Mean Time Between Failures as a prediction instead of an average
Many teams assume Mean Time Between Failures tells them when a machine will fail next. It doesn’t. It’s a backward-looking average. Using it as a forecasting tool leads to poorly timed interventions and misplaced confidence in ageing assets.
2. Counting every stoppage as a “failure”
Electrical blips, operator resets, blocked sensors or planned washings often get lumped into failure logs. That inflates the number of failures and crushes Mean Time Between Failures artificially. Without a strict, shared definition of “failure,” the metric loses meaning and triggers the wrong decisions.
3. Ignoring the impact of Mean Time Between Failures
A high Mean Time Between Failures can look impressive, but it tells only half the story. If repair times are long, overall availability still suffers. Companies often celebrate Mean Time Between Failures improvements while missing the fact that MTTR (Mean Time Between Repairs) is quietly eroding productivity and consuming budget.
4. Using Mean Time Between Failures as a standalone metric
Mean Time Between Failures becomes dangerously misleading when isolated. Without linking it to failure modes, maintenance logs, environmental conditions, and Opex or Capex impact, teams draw the wrong conclusions. Mean Time Between Failures is powerful, but only when combined with context.
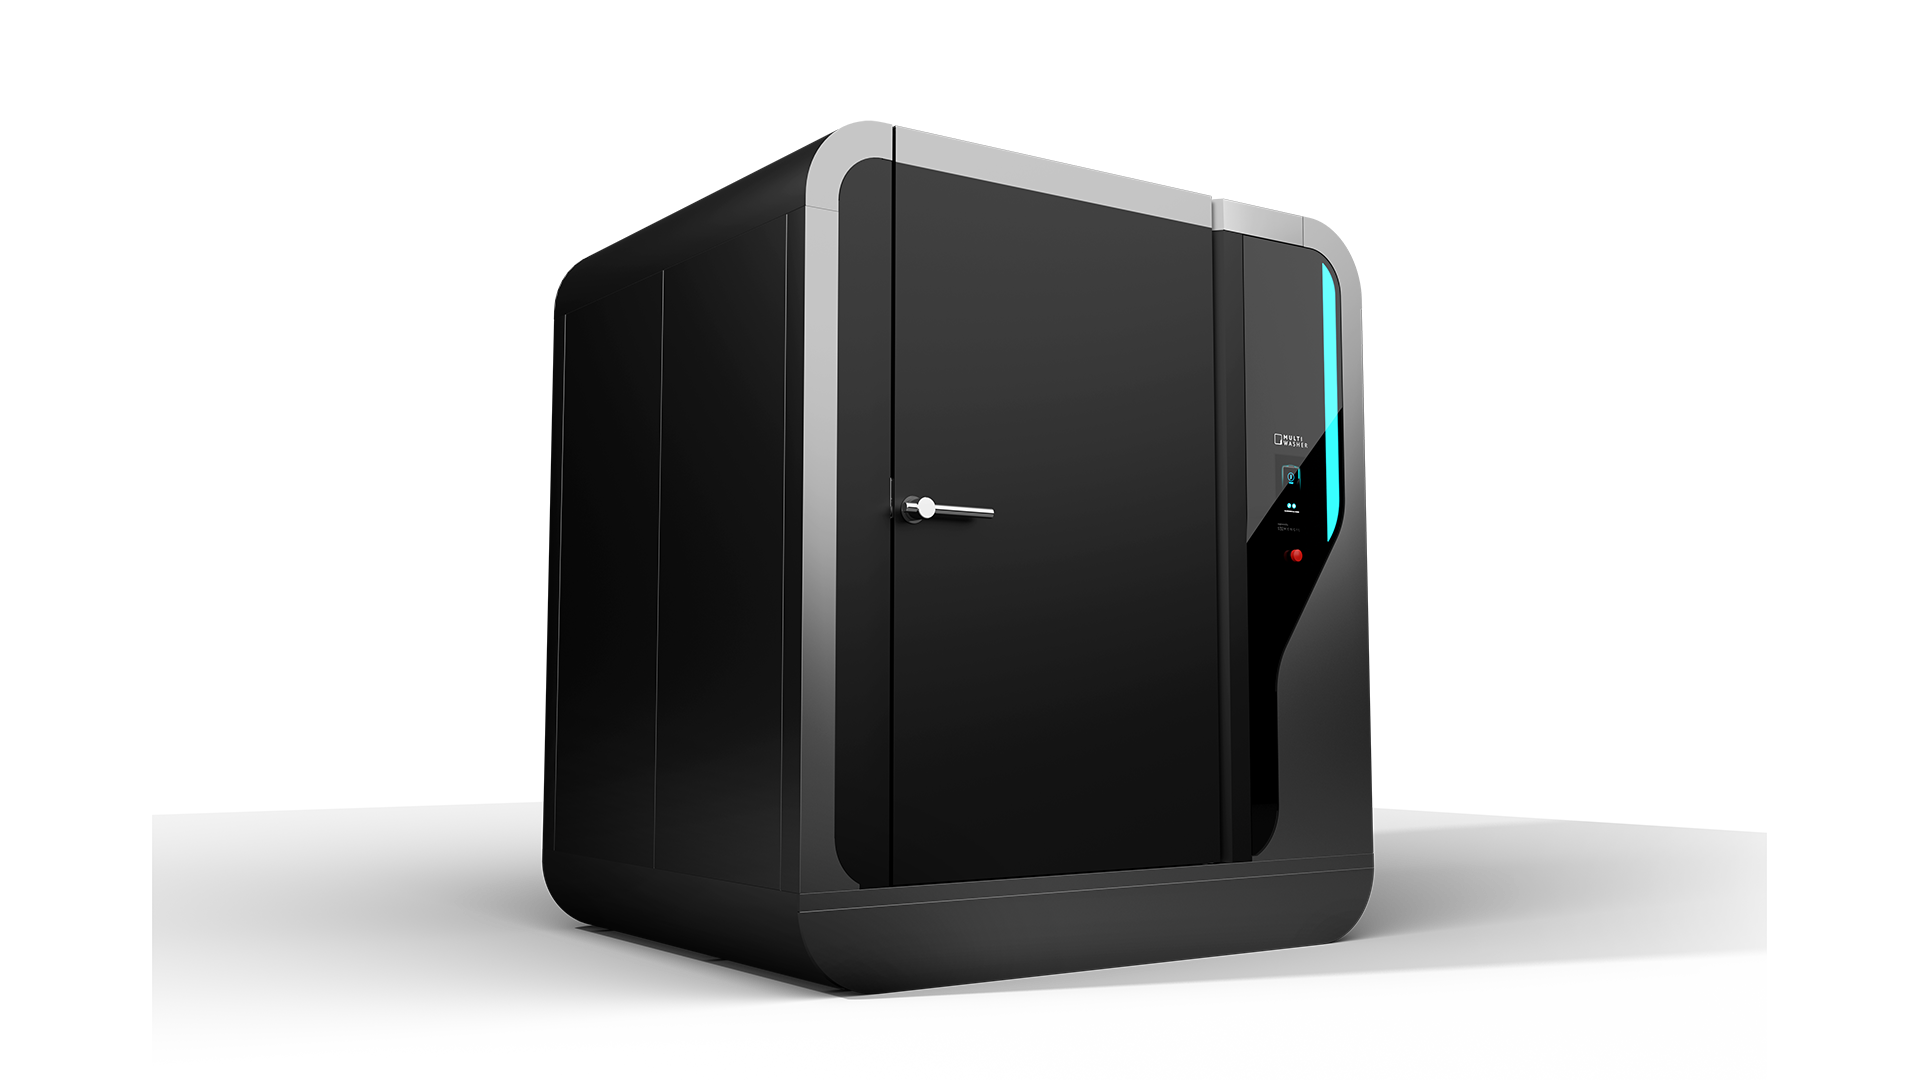
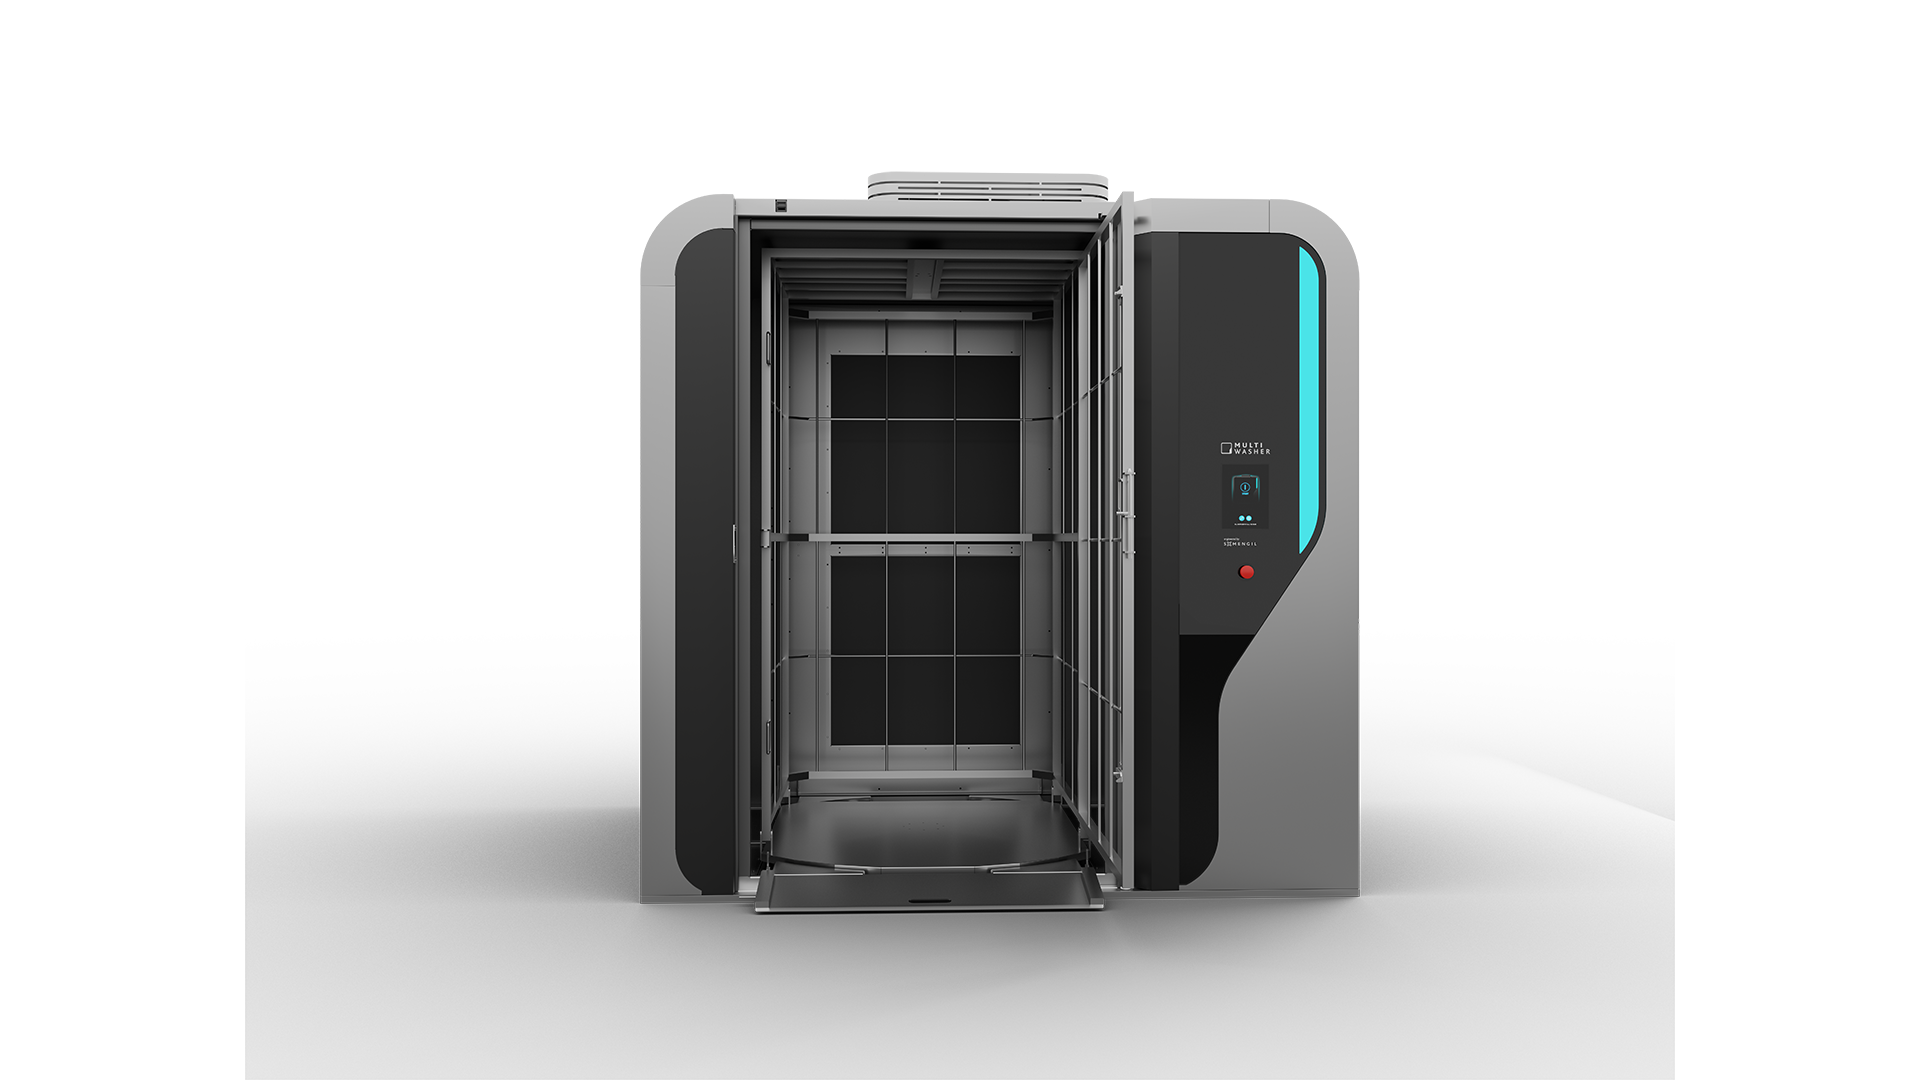
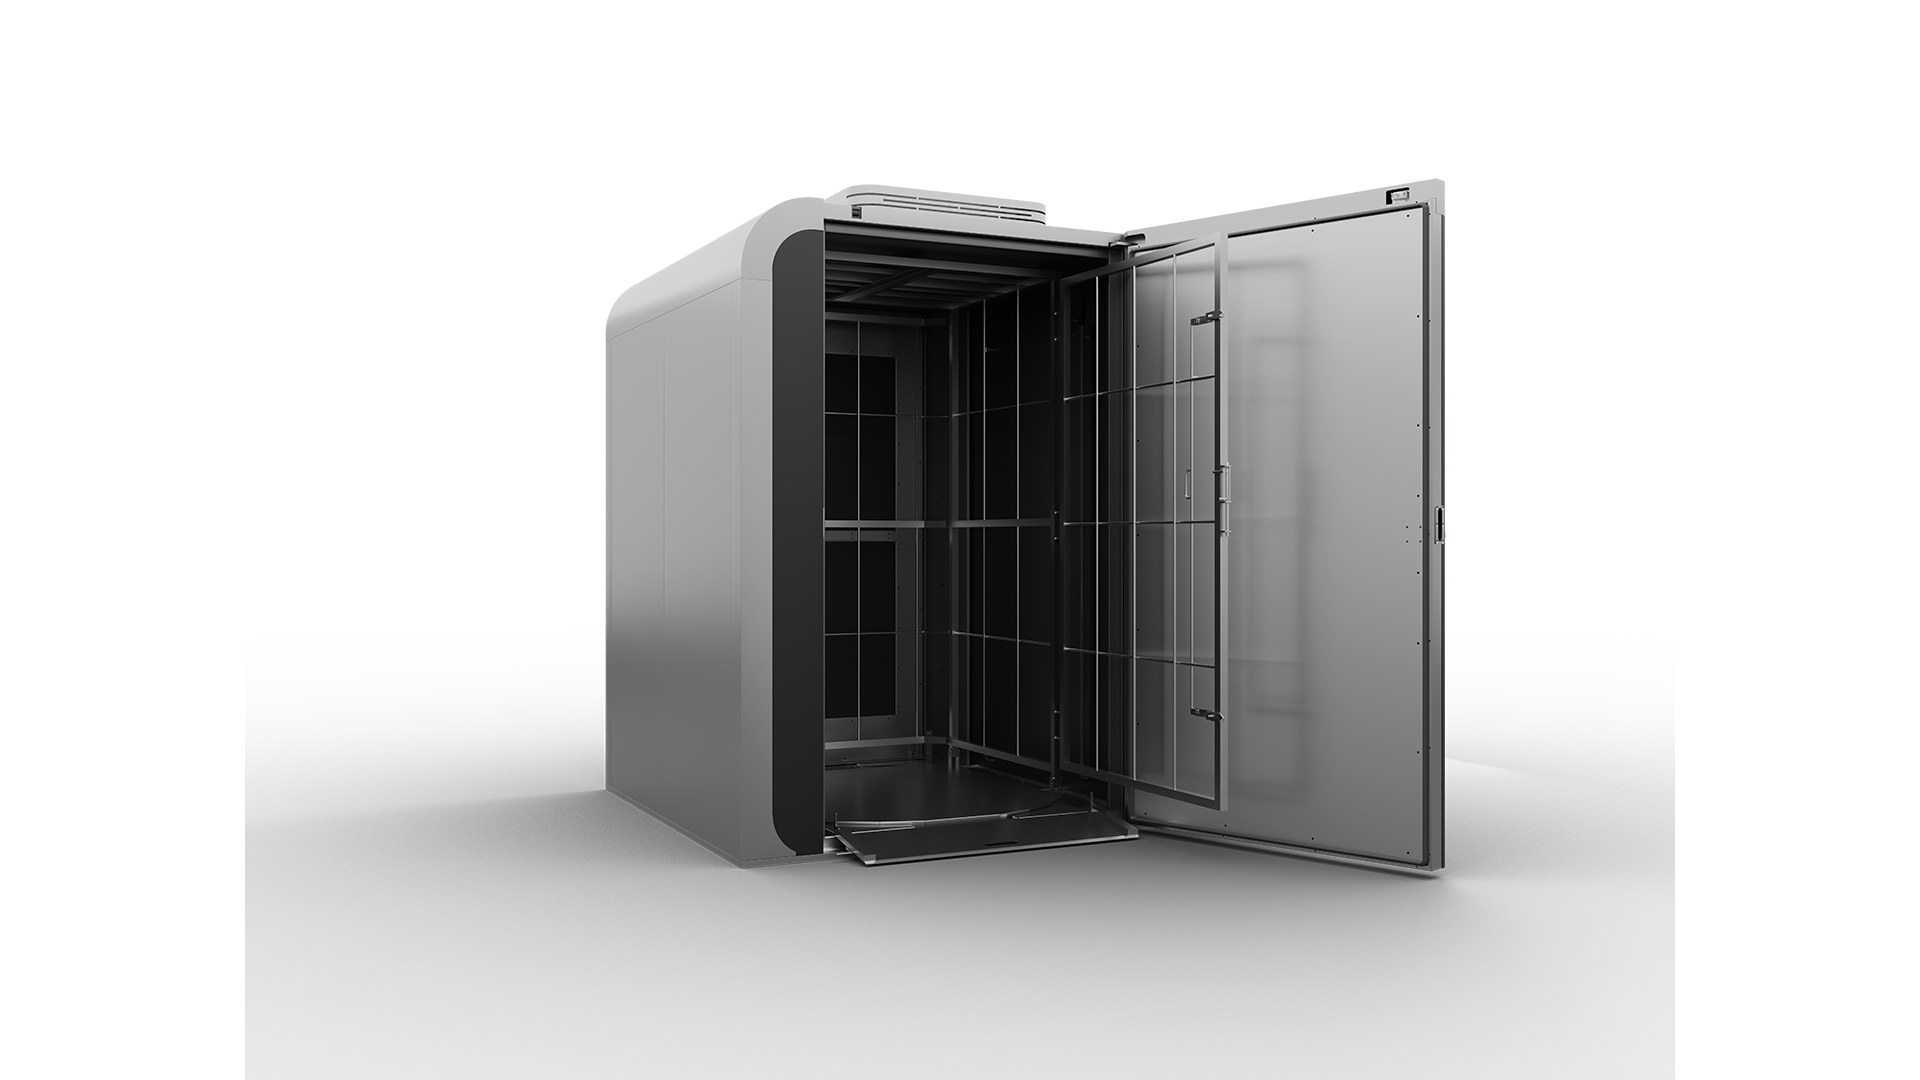
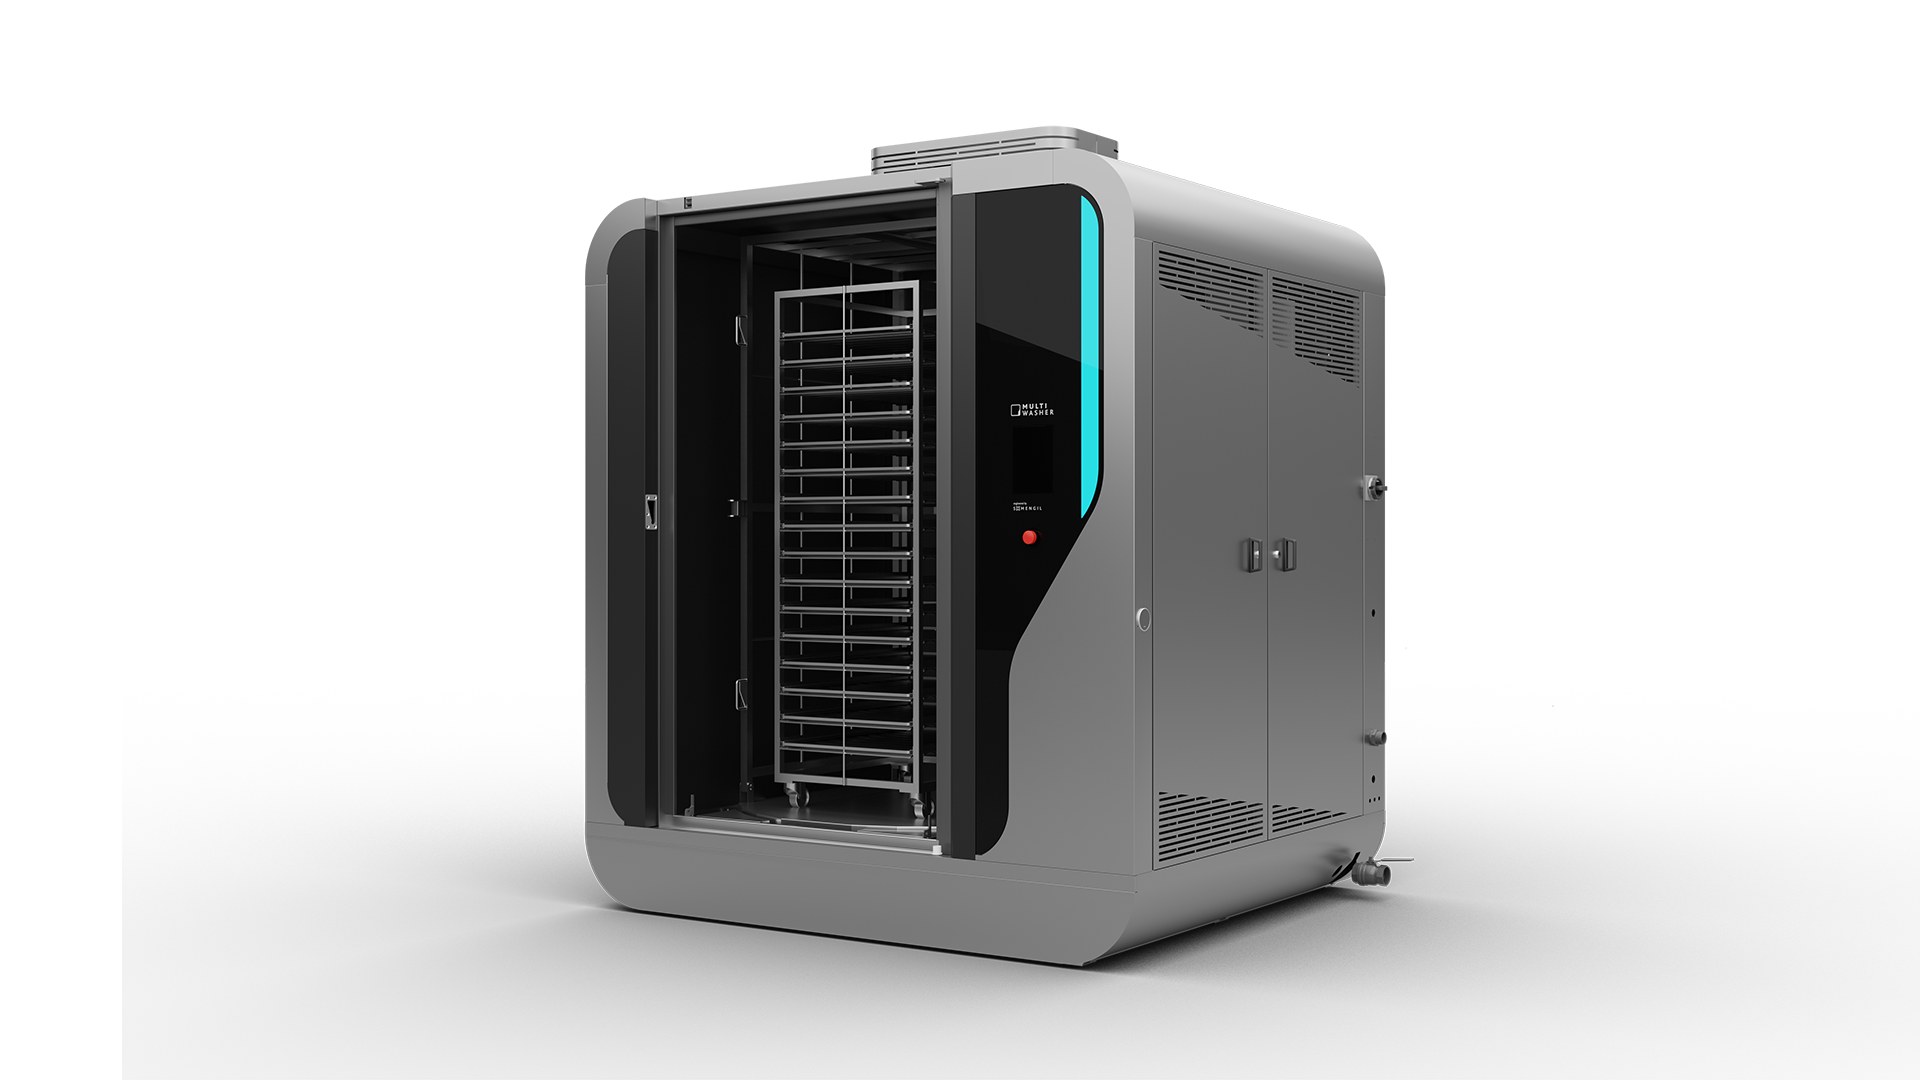
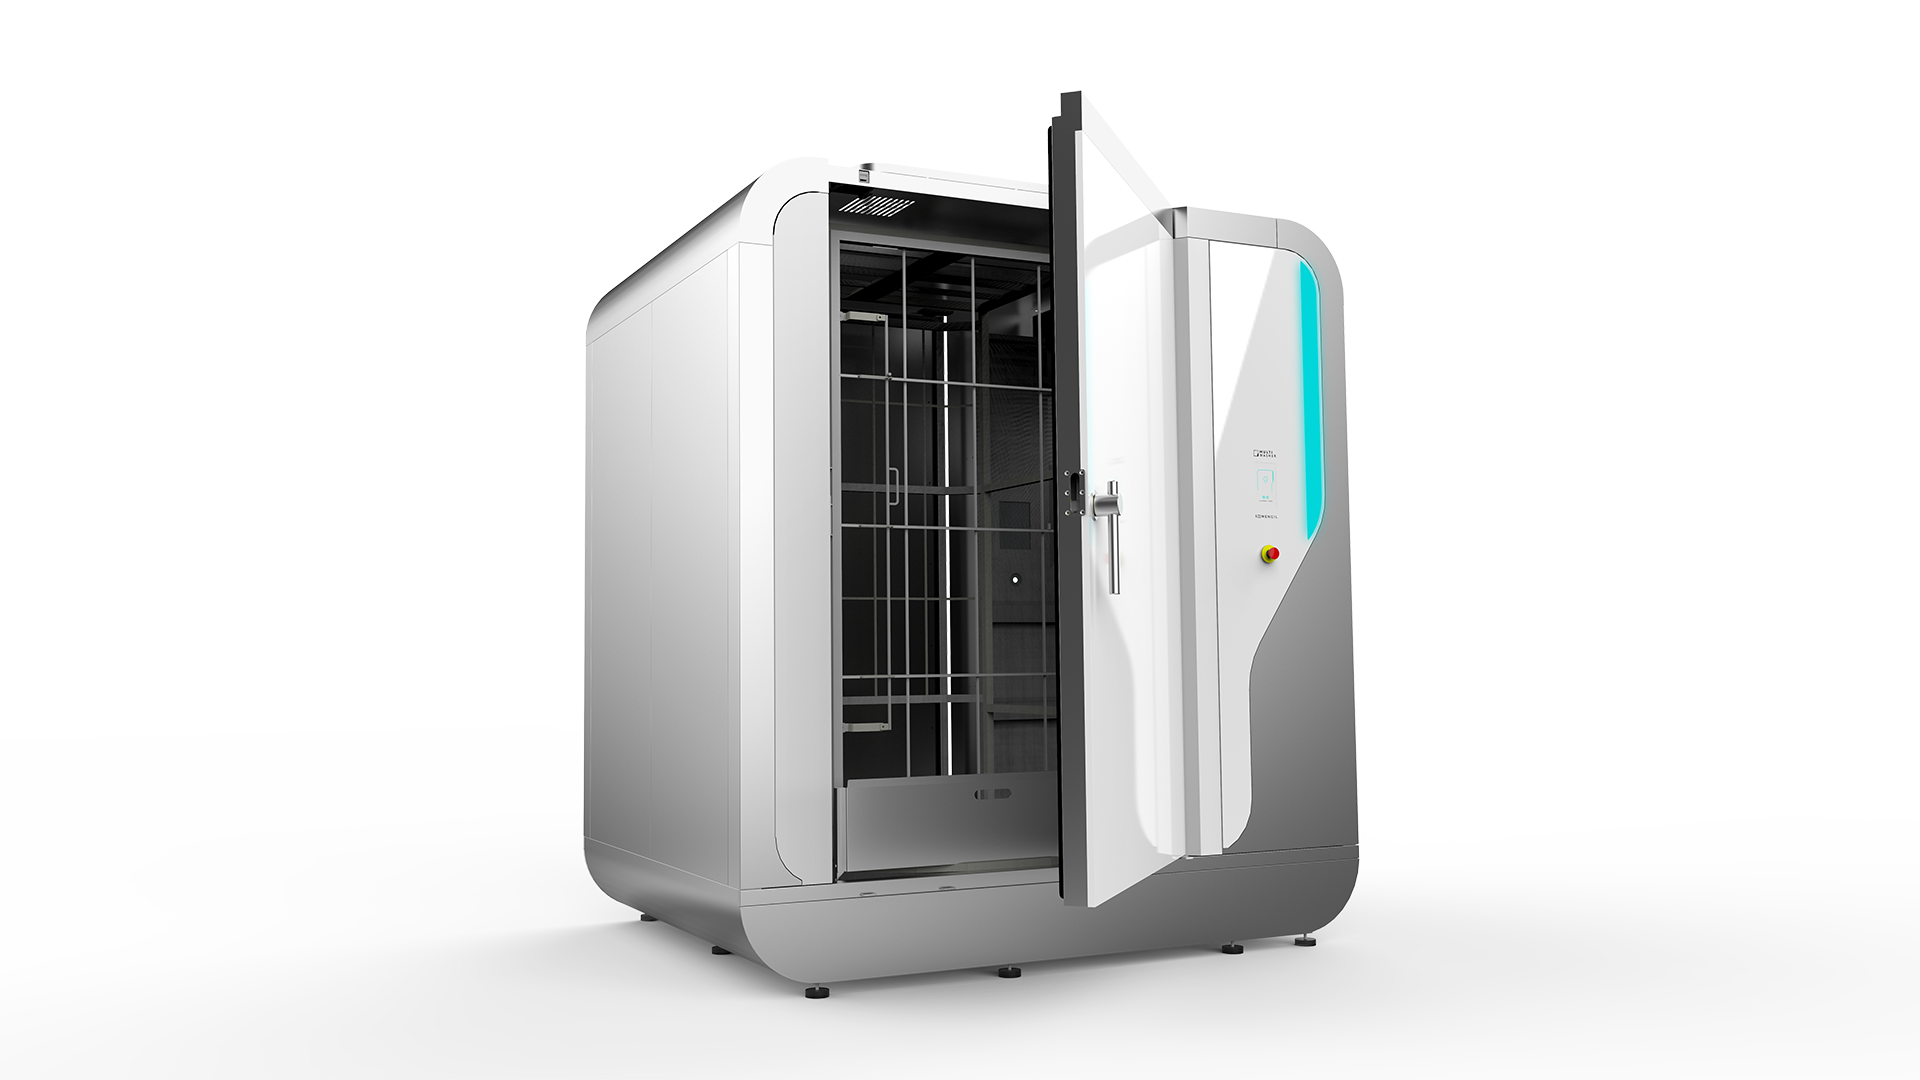
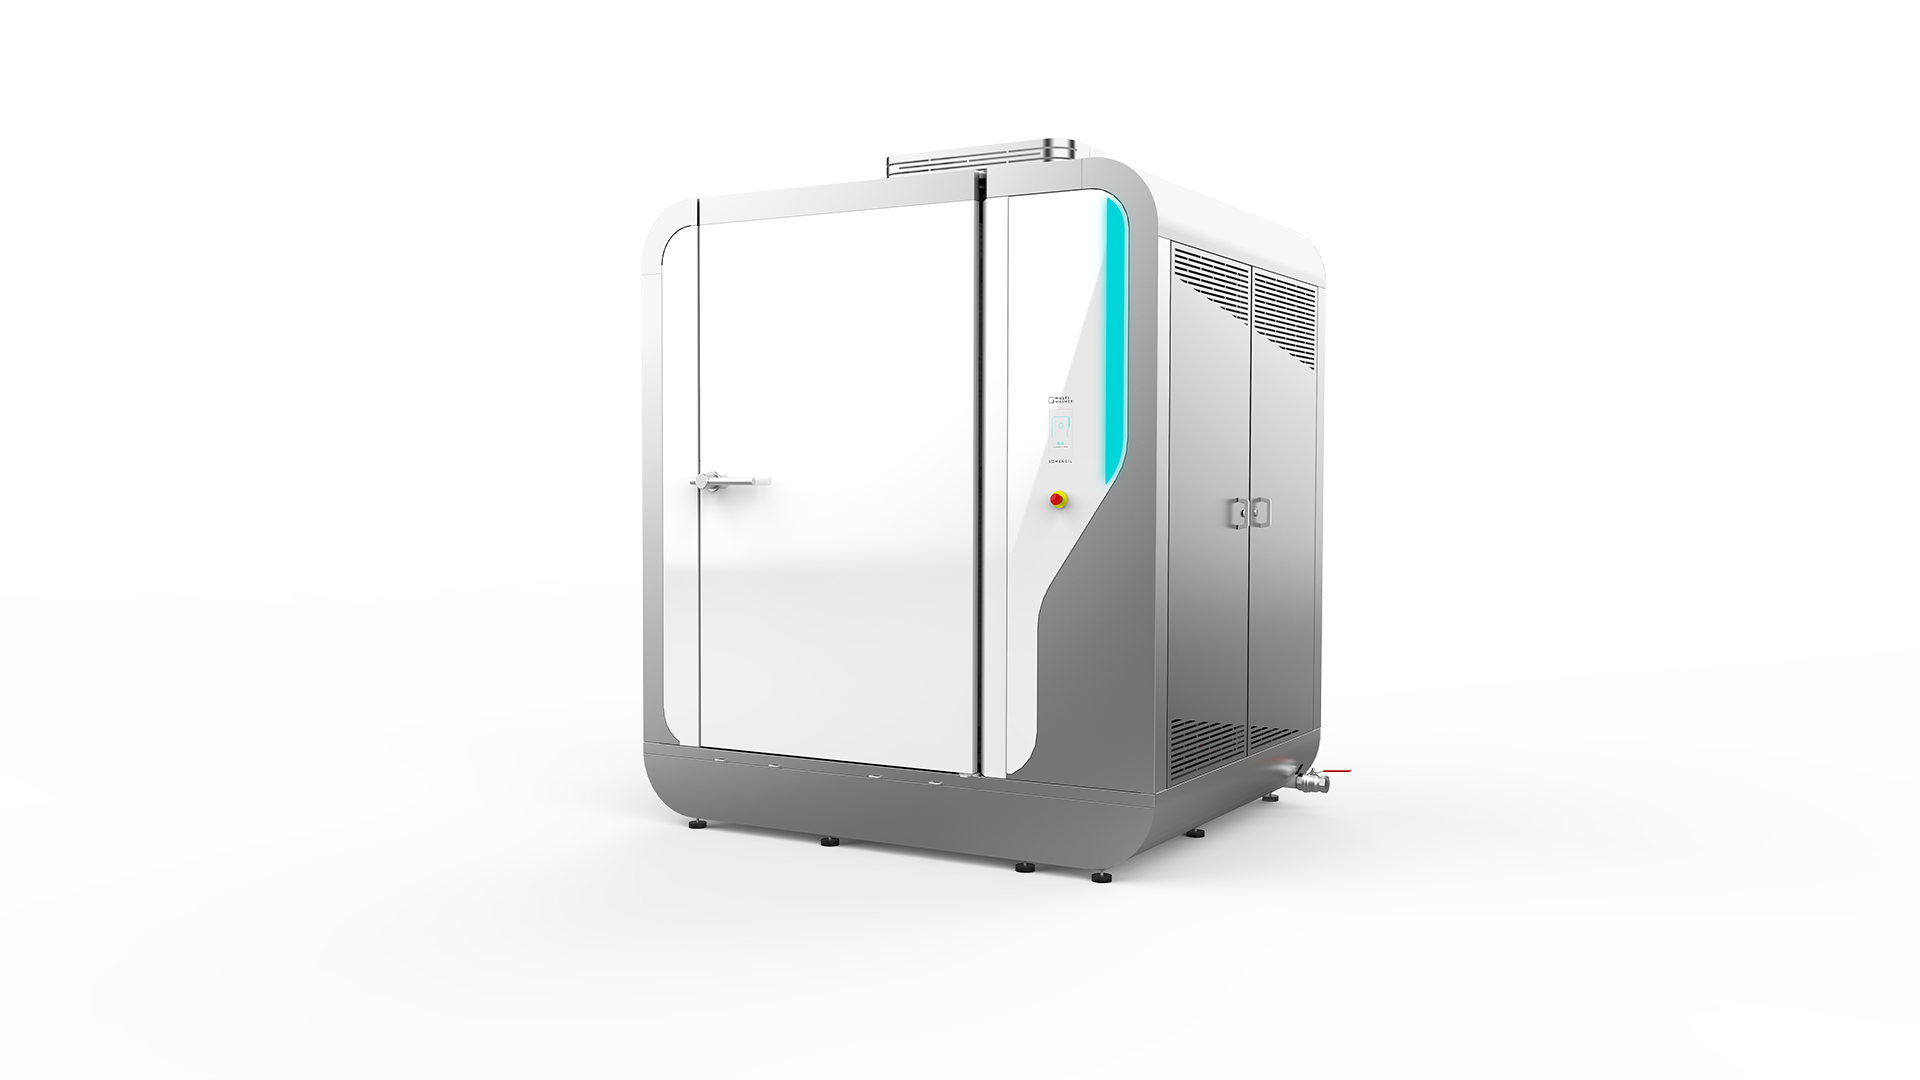
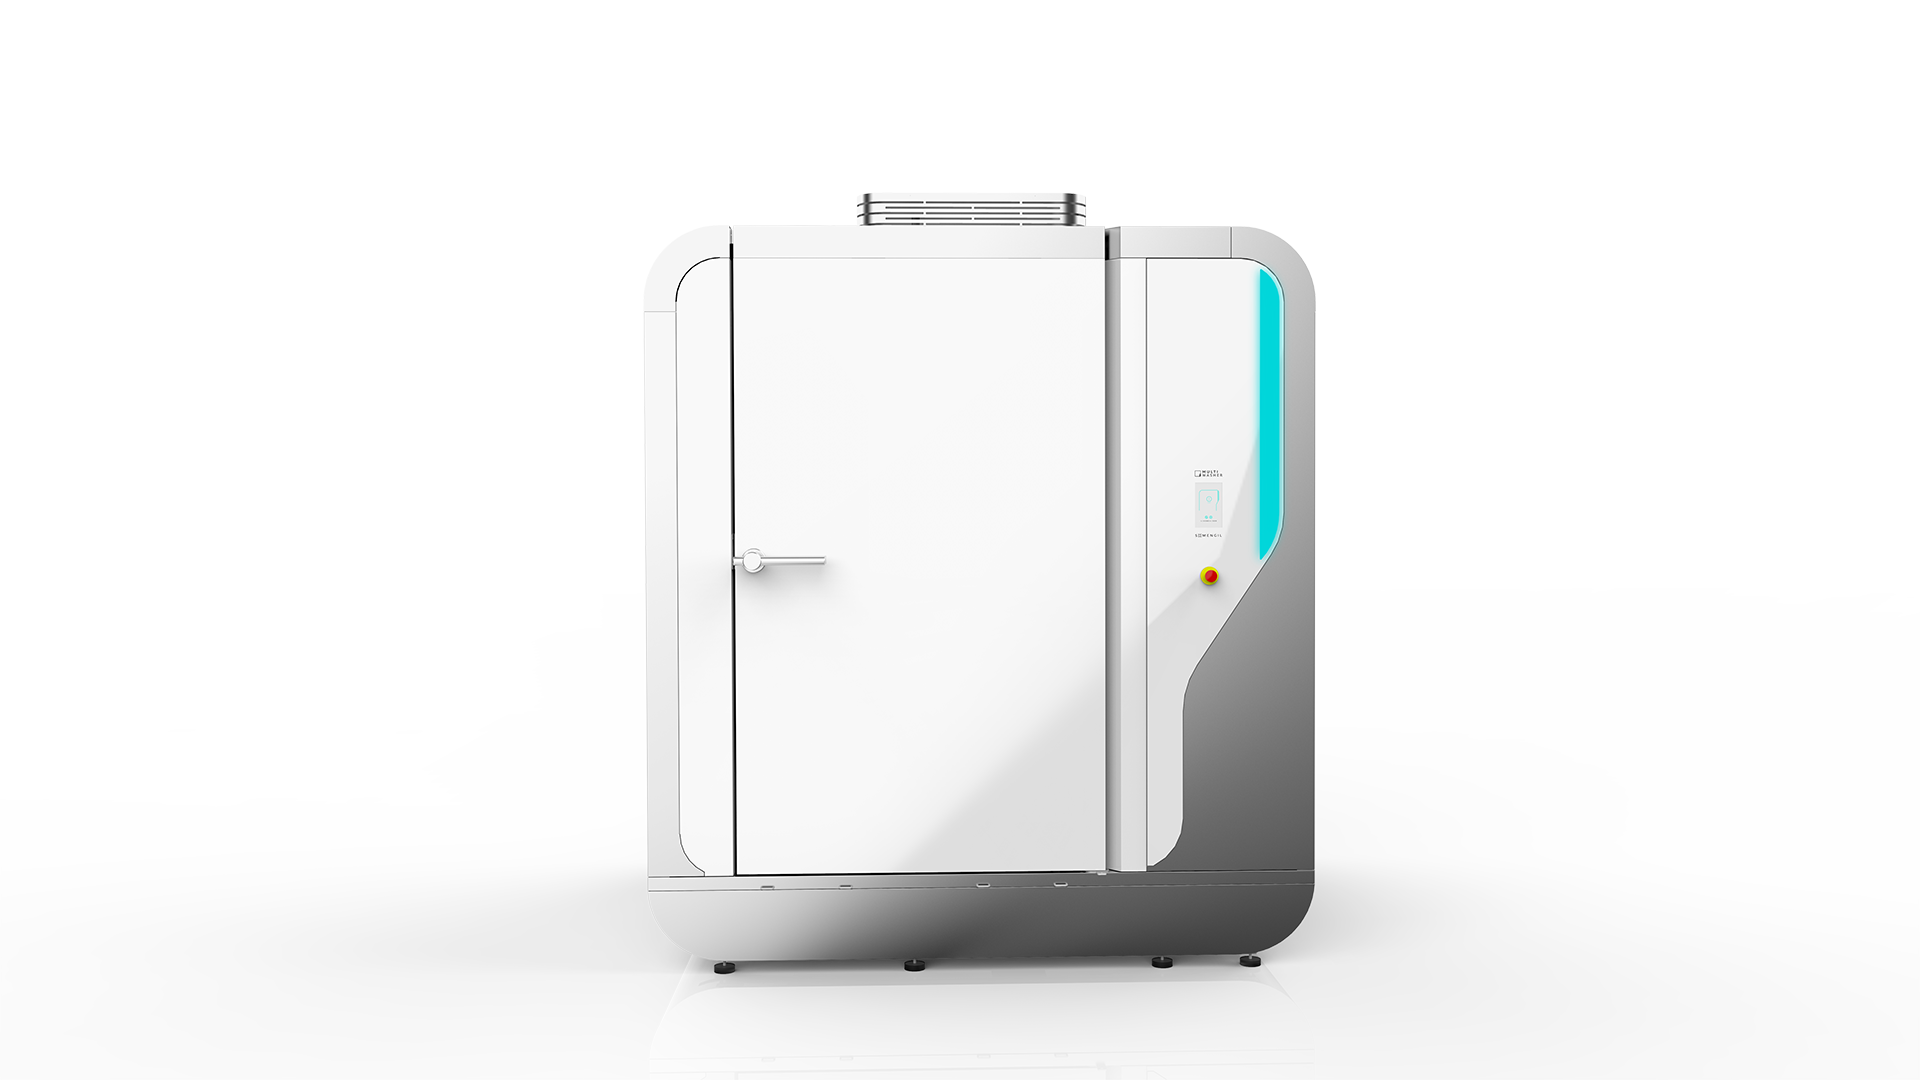
Improve your Mean Time Between Failures with MultiWasher
Mean Time Between Failures becomes genuinely useful when it acts as a reality check on how your equipment behaves day after day. Once you follow it closely, you notice patterns that were easy to miss: small shifts in washing quality, components that deteriorate faster than expected, or processes that quietly add stress to the line. And that clarity helps you make better decisions, the ones that protect uptime and keep production flowing.
This is where the MultiWasher brings the process under control. Its closed-loop filtration avoids particle recirculation, which is a common cause of premature wear in pumps and valves. Stable temperature control protects seals and bearings. The mechanical design reduces points of friction and makes inspections quicker, which keeps MTTR small. And because the process is highly repeatable, you remove the variability that usually shows up as “mystery failures” later in the line.
If you’re trying to improve Mean Time Between Failures, exploring the MultiWasher is a practical next step. Get in touch to see how much Mean Time Between Failures you can recover by upgrading your washing process.
You may also like

Industrial washing / Articles
Interview “Carne” Magazine
My arrival at Somengil was on January 2, 2010. I had worked in the automotive, banking and medical information areas, and I was.
Posted in 2023-05-03

Industrial washing / Articles
Meat industry: the complete guide for a perfect washing solution
The meat industry has specific hygiene needs stemming from a high risk of contamination. Find out how to choose the best washing solution.
Posted in 2023-09-07


 Portugal
 United Kingdom
 United States
 France
 Spain
Spain Germany
 Romania
 Italy
Italy Czech Republic
 Finland
 Hungary
 Slovakia
 Greece
 Lithuania
 South Korea
 Russia
 Saudi Arabia
 Poland
 Brasil
 Hebrew