
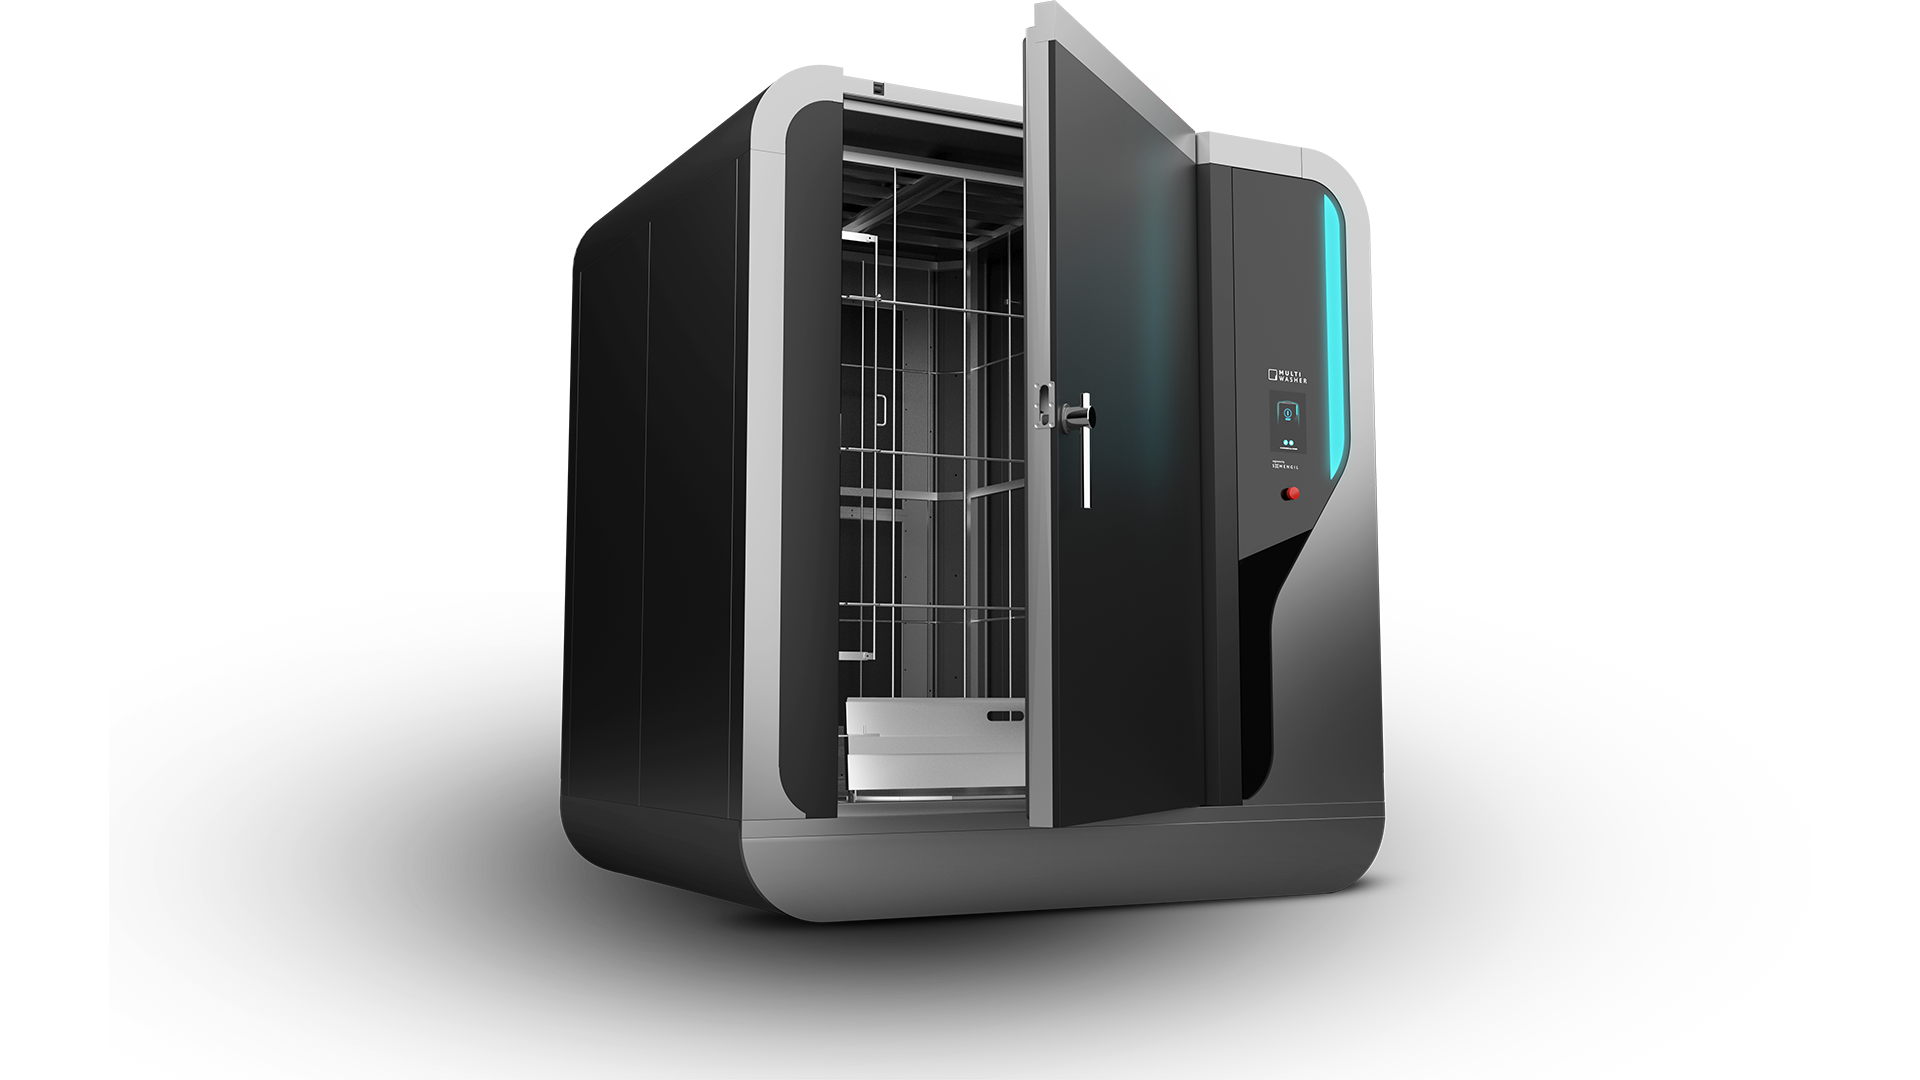
Multiwasher
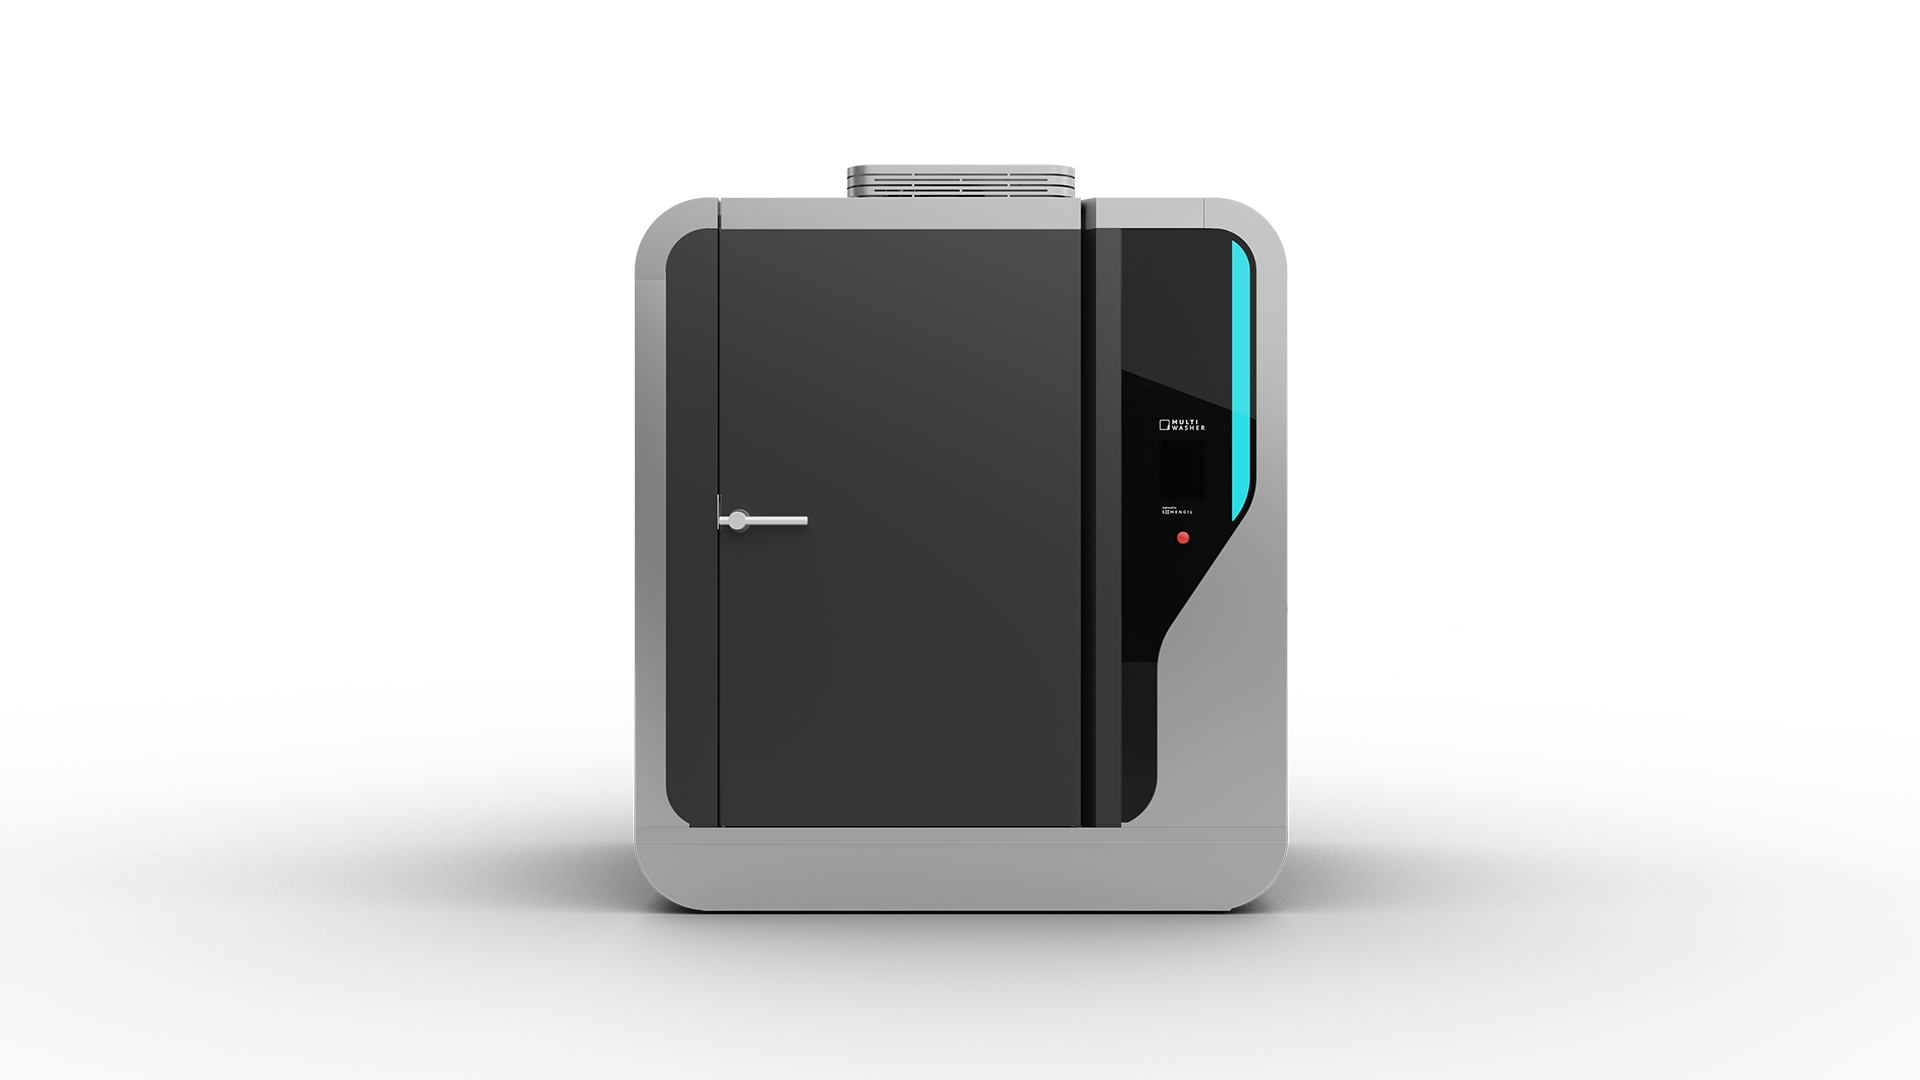
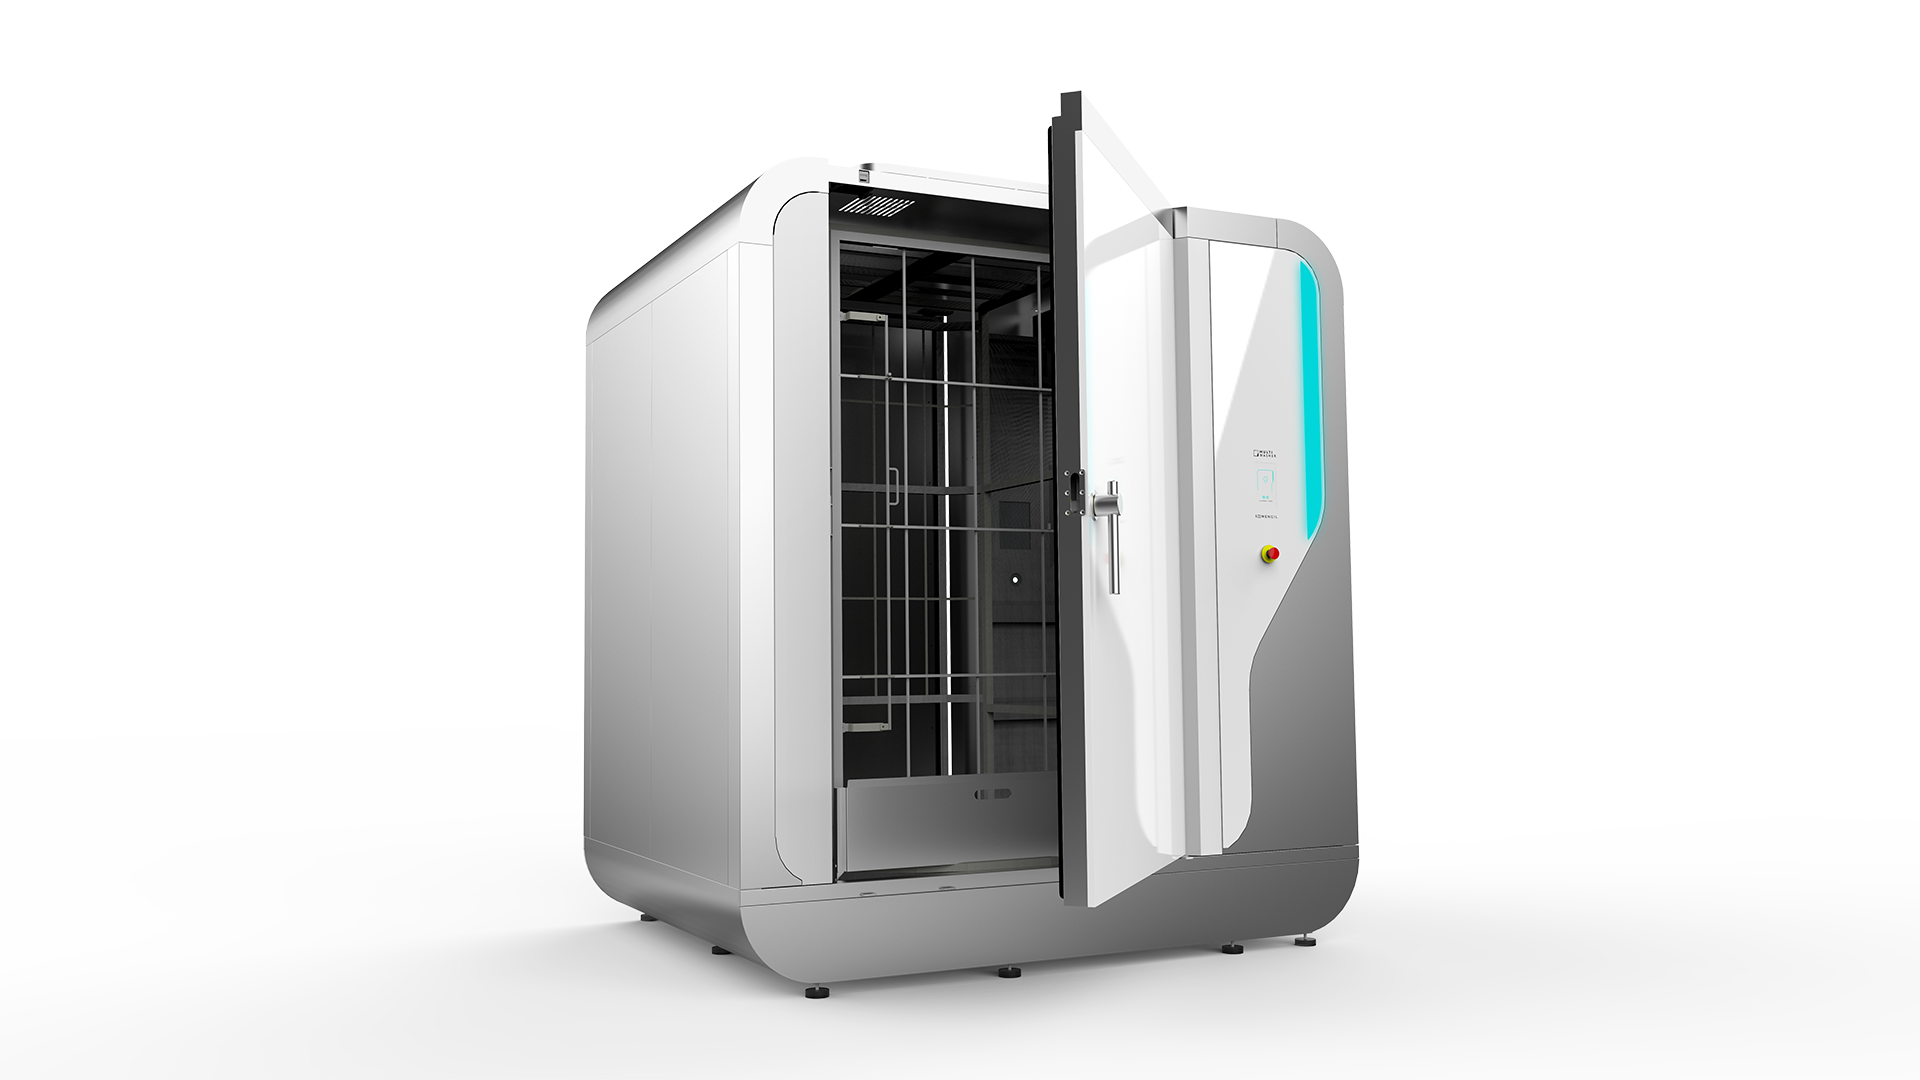
Multiwasher is an industrial washing appliance
created to adapt to customers' needs. It ensures the efficiency and
effectiveness required for washing and disinfecting in your industry.
Industries
Multiwasher has been designed to adapt to
different industry segments, with the possibility of integrating various
utensils and various purposes in a single wash, thus allowing for greater
flexibility.

Services
We support our customers in using our equipment
with maximum effectiveness, whether that is through an optimized configuration
or through training and coaching.
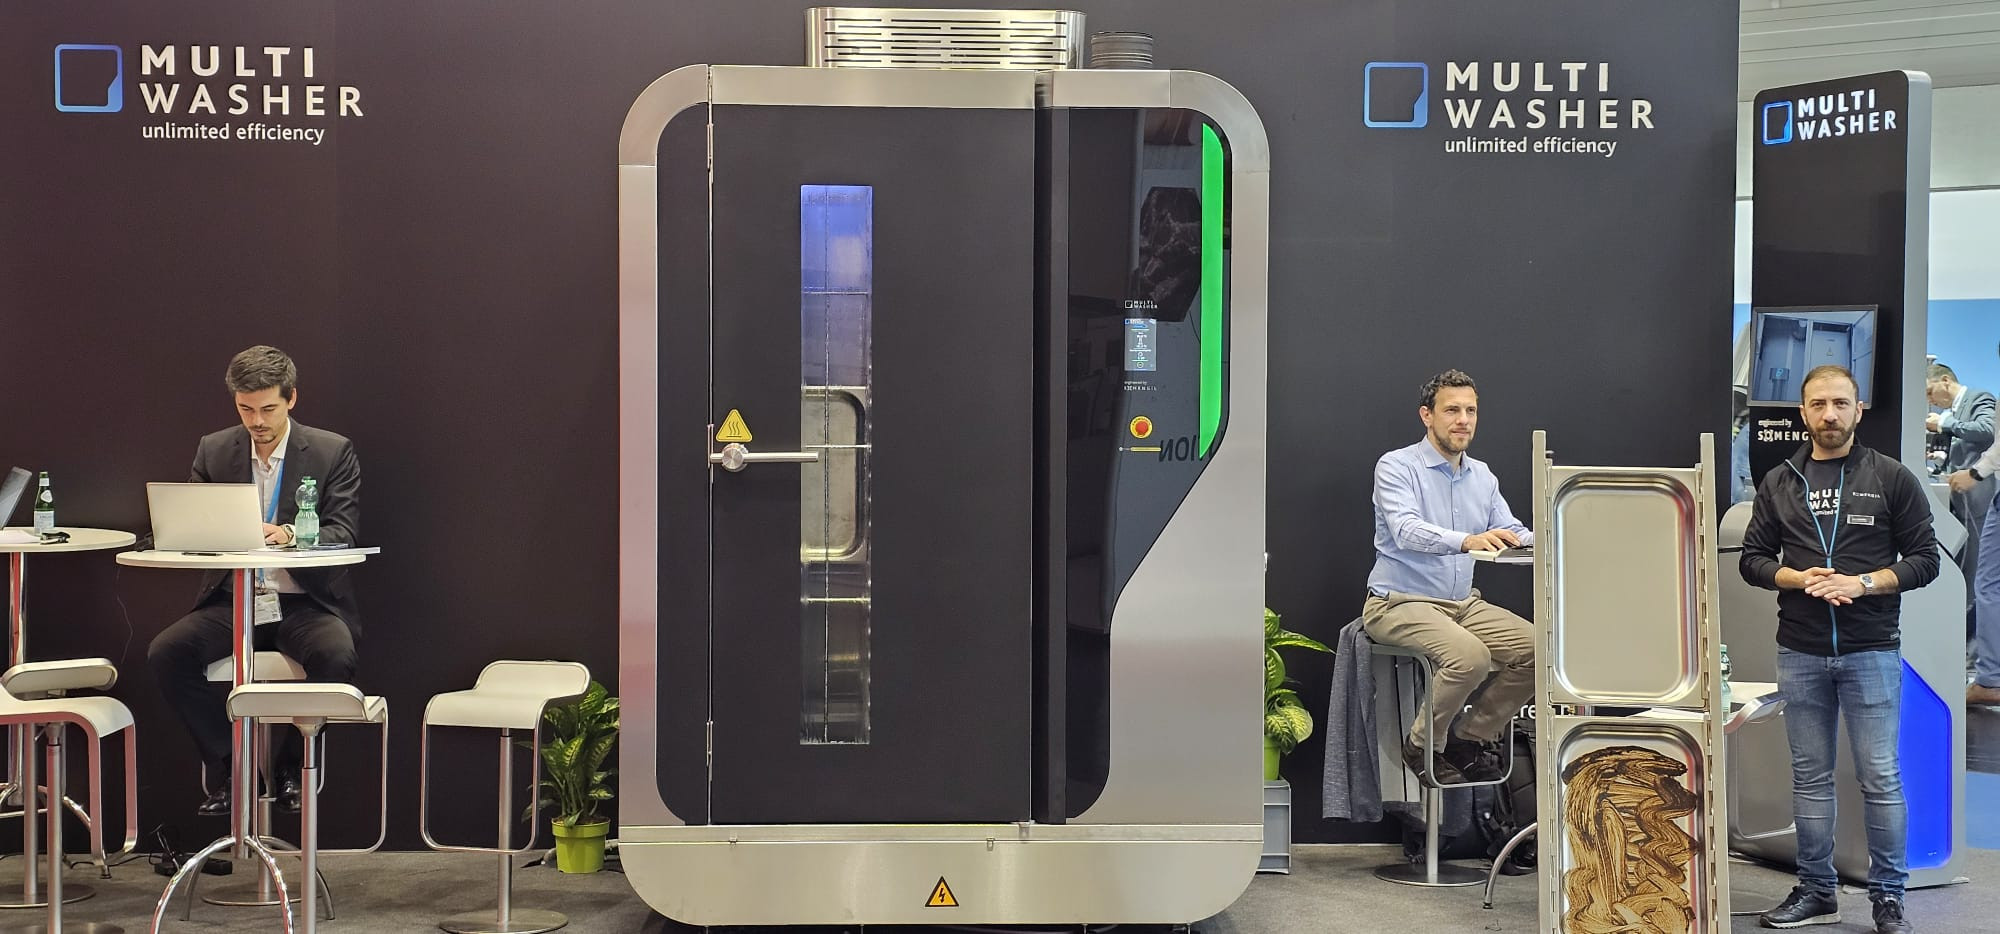
Events
Check out the latest updates and news about
upcoming trade shows at which Somengil will be present.
Webinars
Our webinar will give you an update on the trends in washing and disinfection applied to the food industry and catering and food service. You will also have the chance to understand how Multiwasher works and how it addresses these trends and presents innovative, efficient and sustainable solutions.
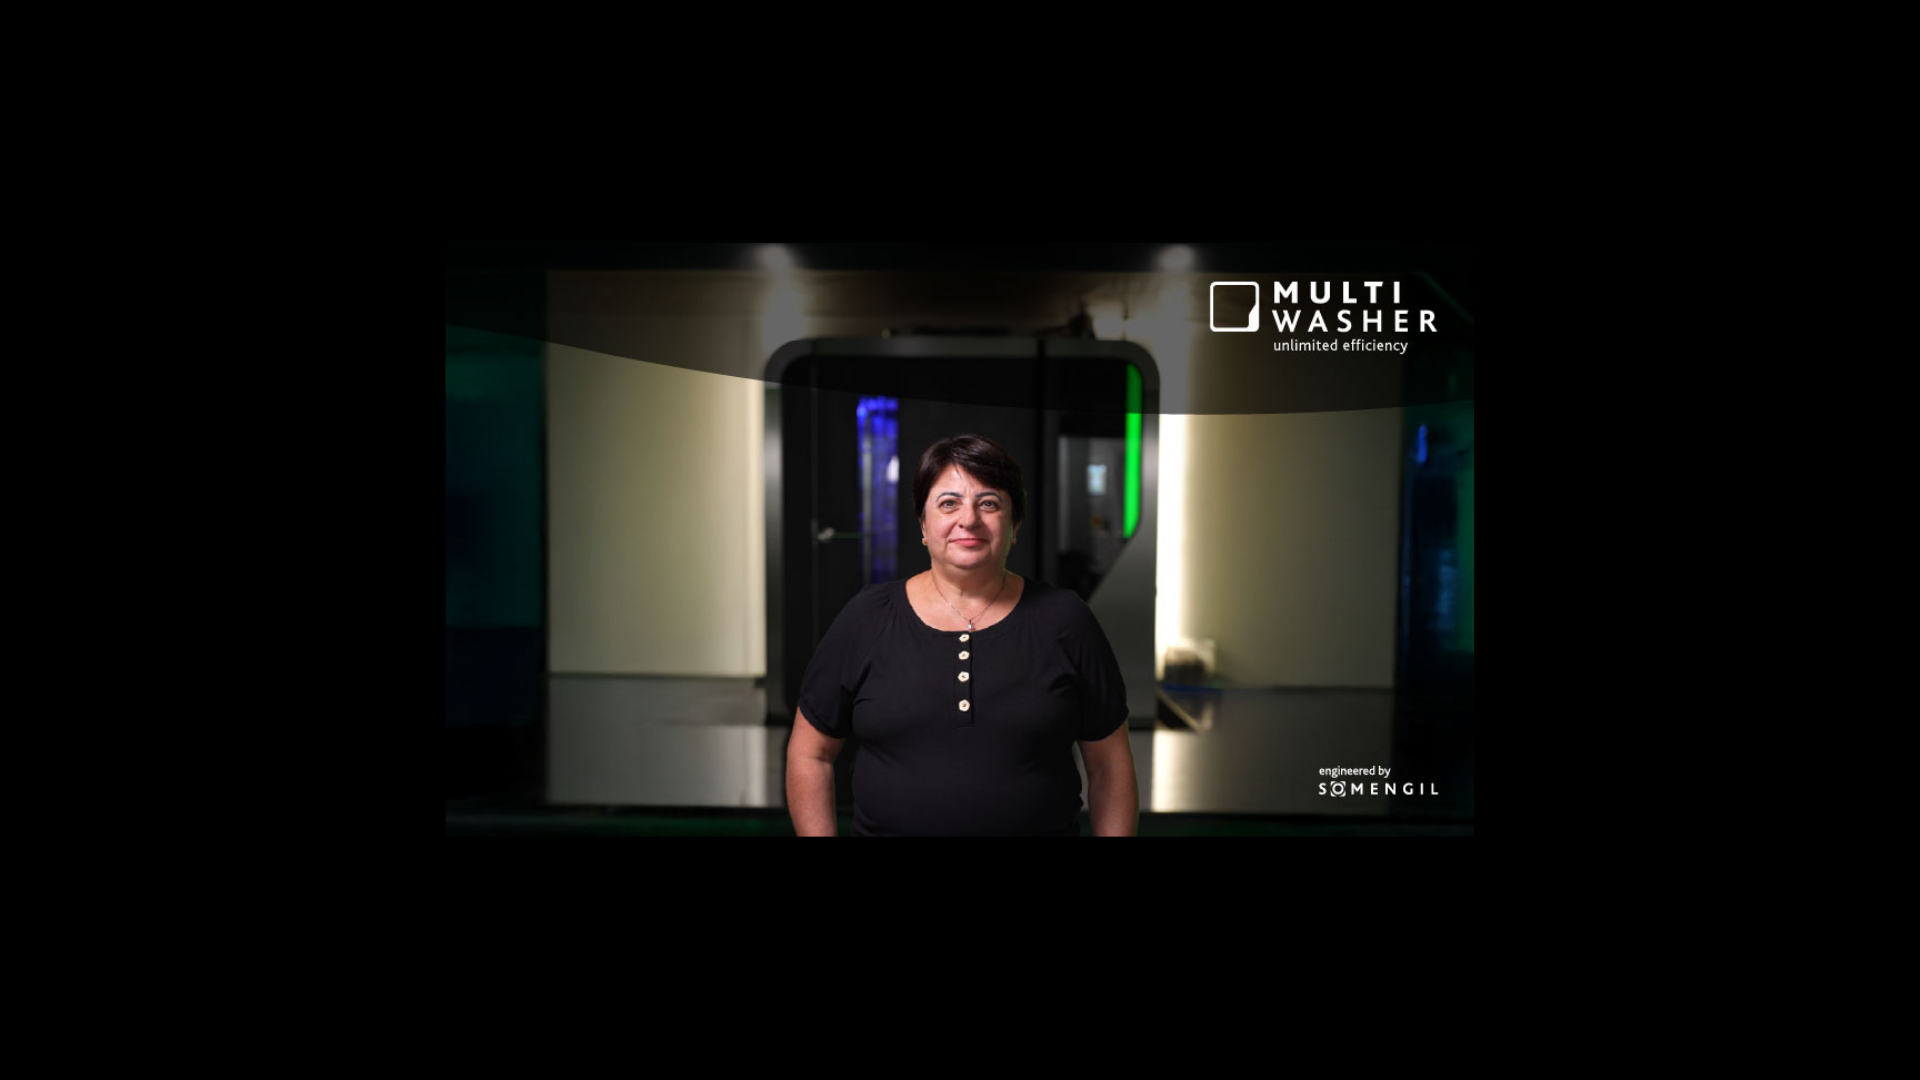
The Multiwasher revolution in Sodexo restaurants
Isabel Aguado, from Sodexo, leads innovation with real results. Find out how Multiwasher is at the heart of this transformation.
Read more on our blog!
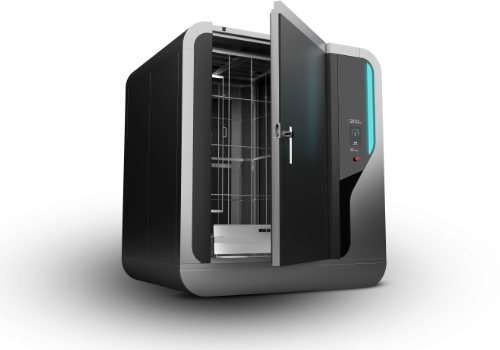
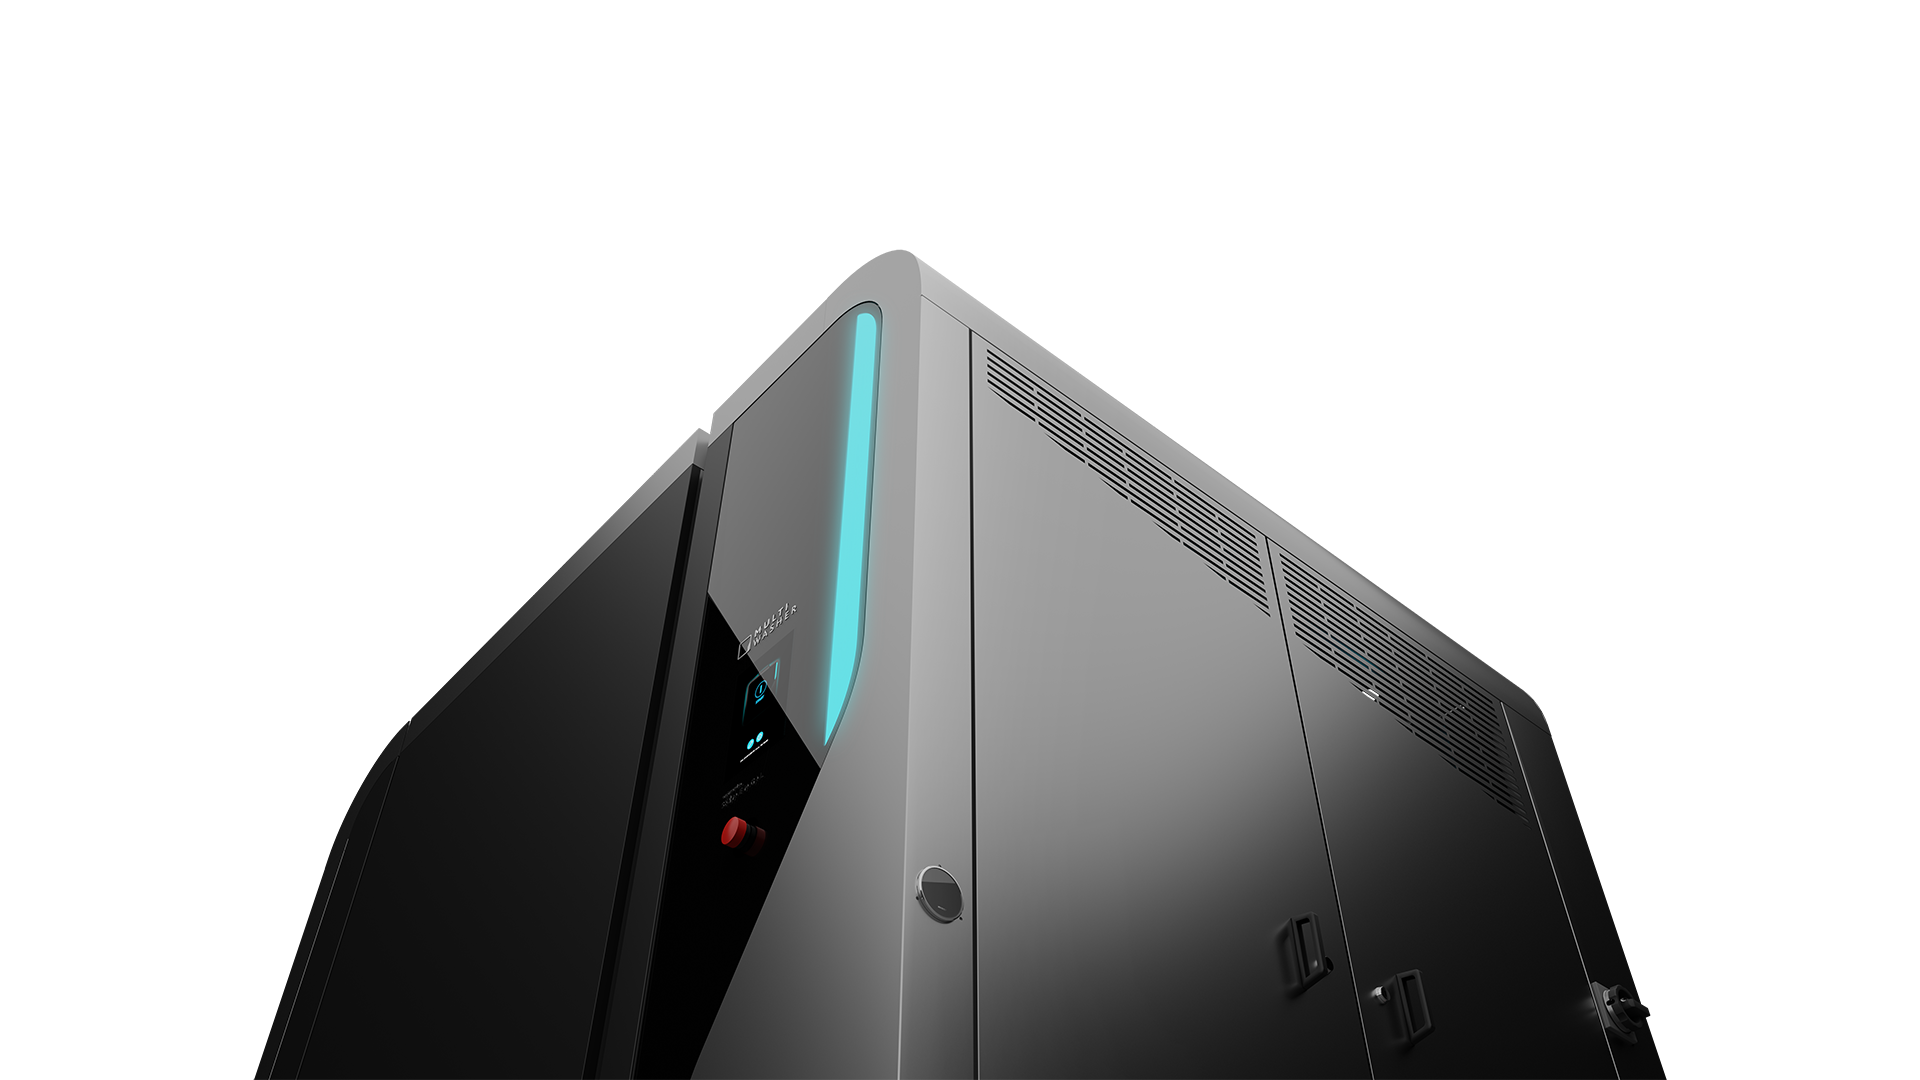
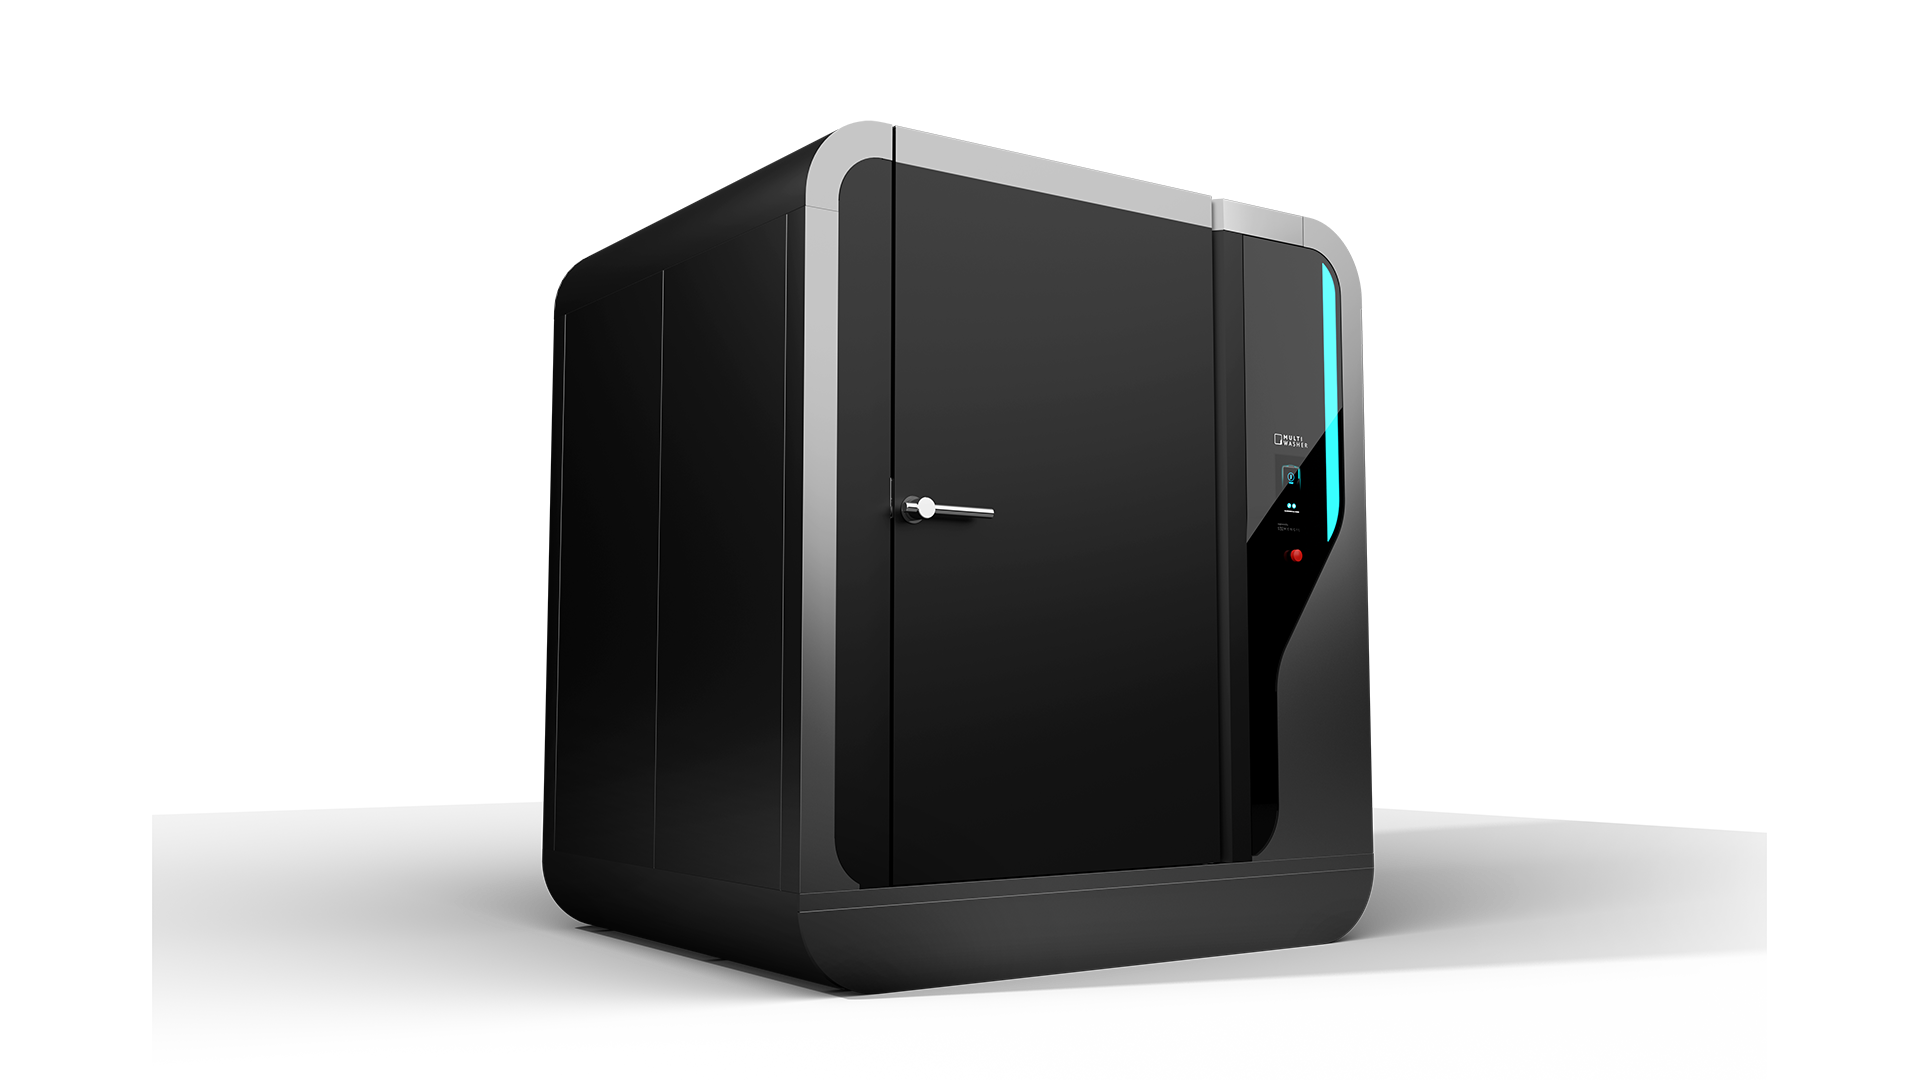
Innovative washing solutions
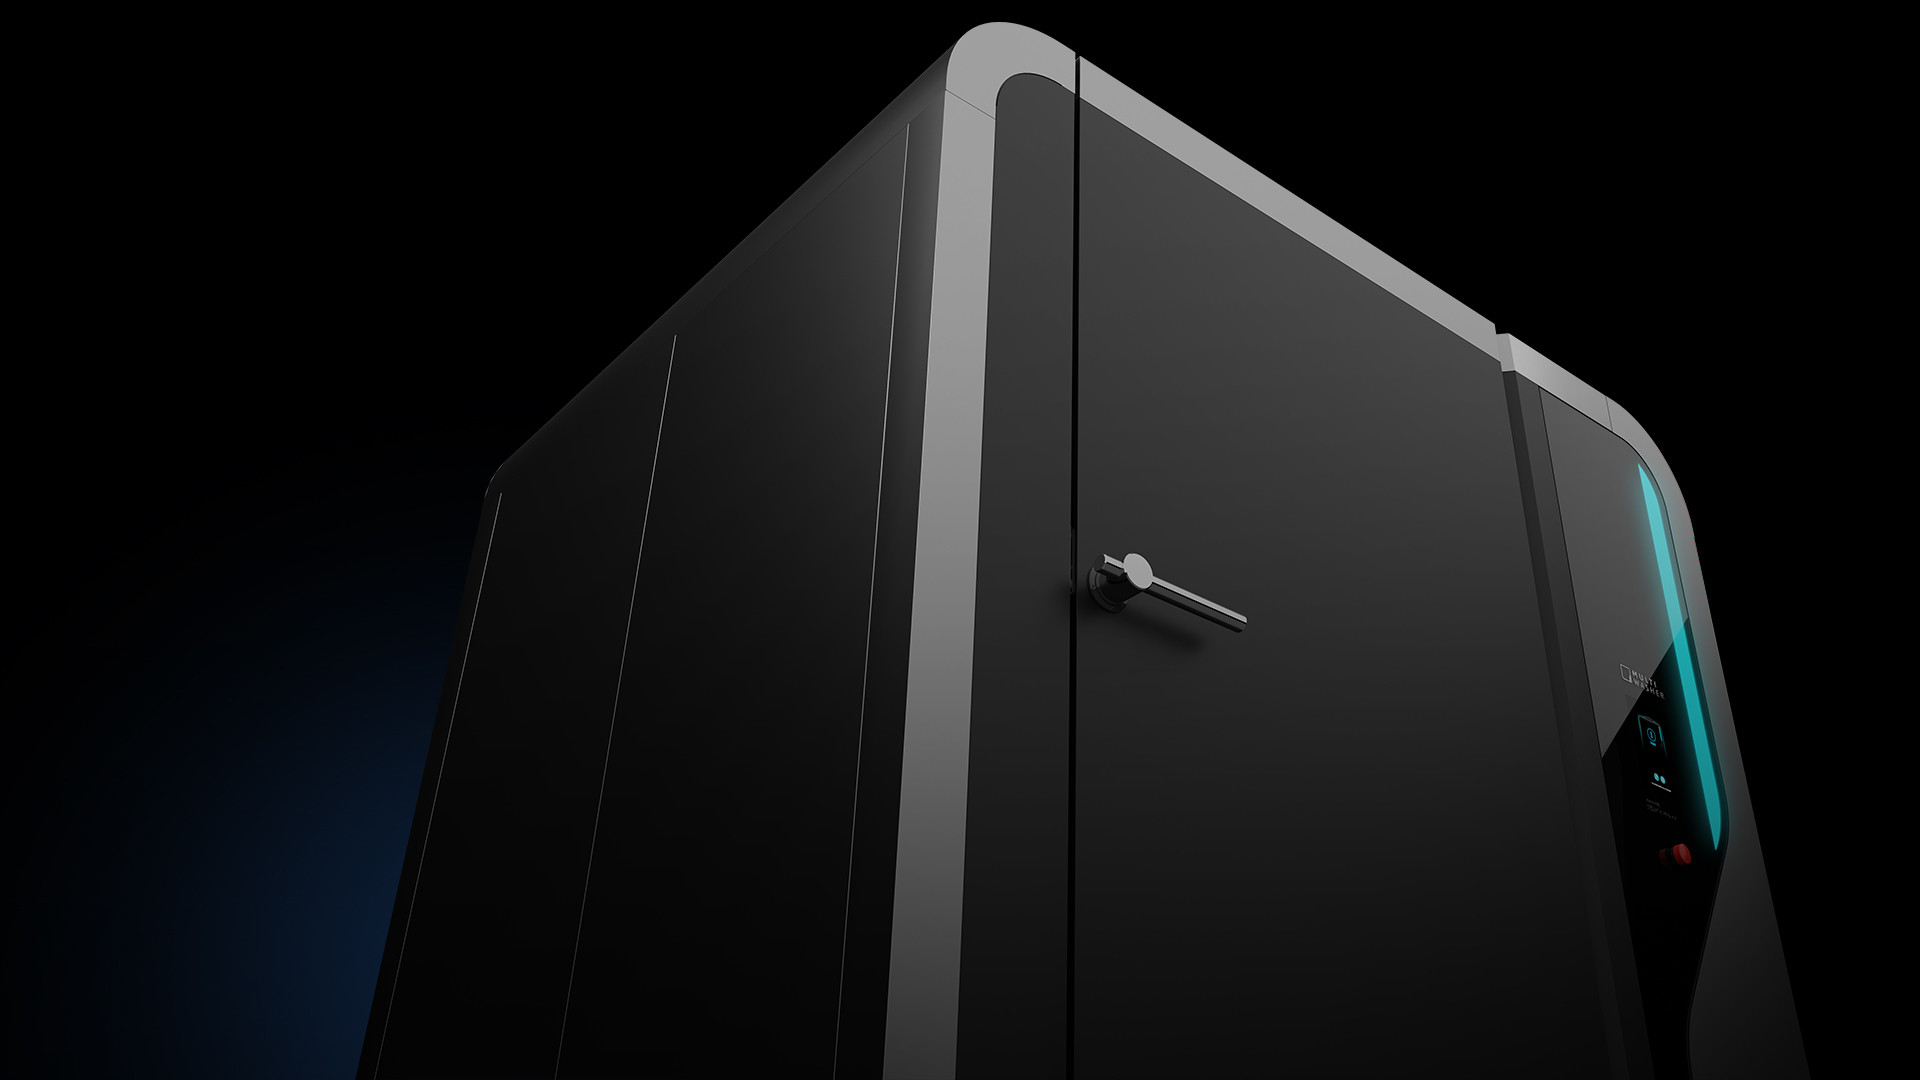
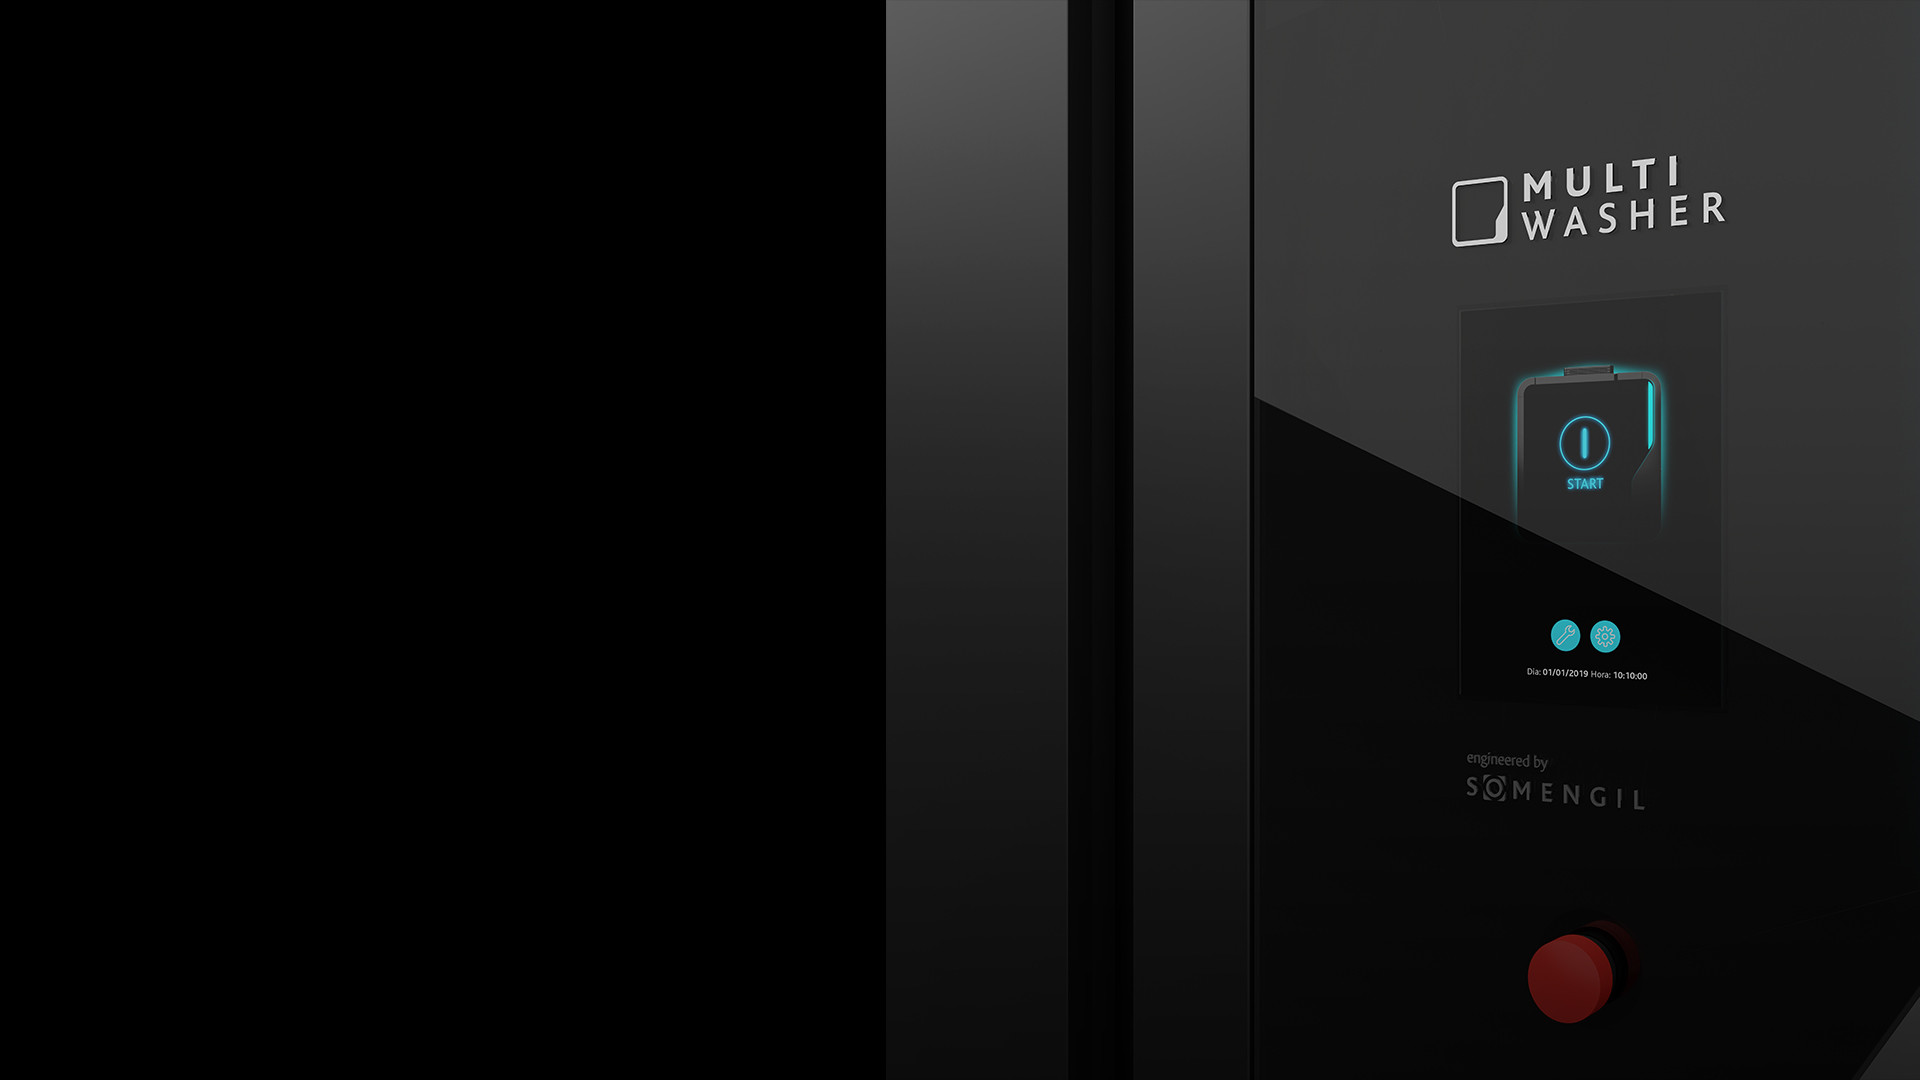
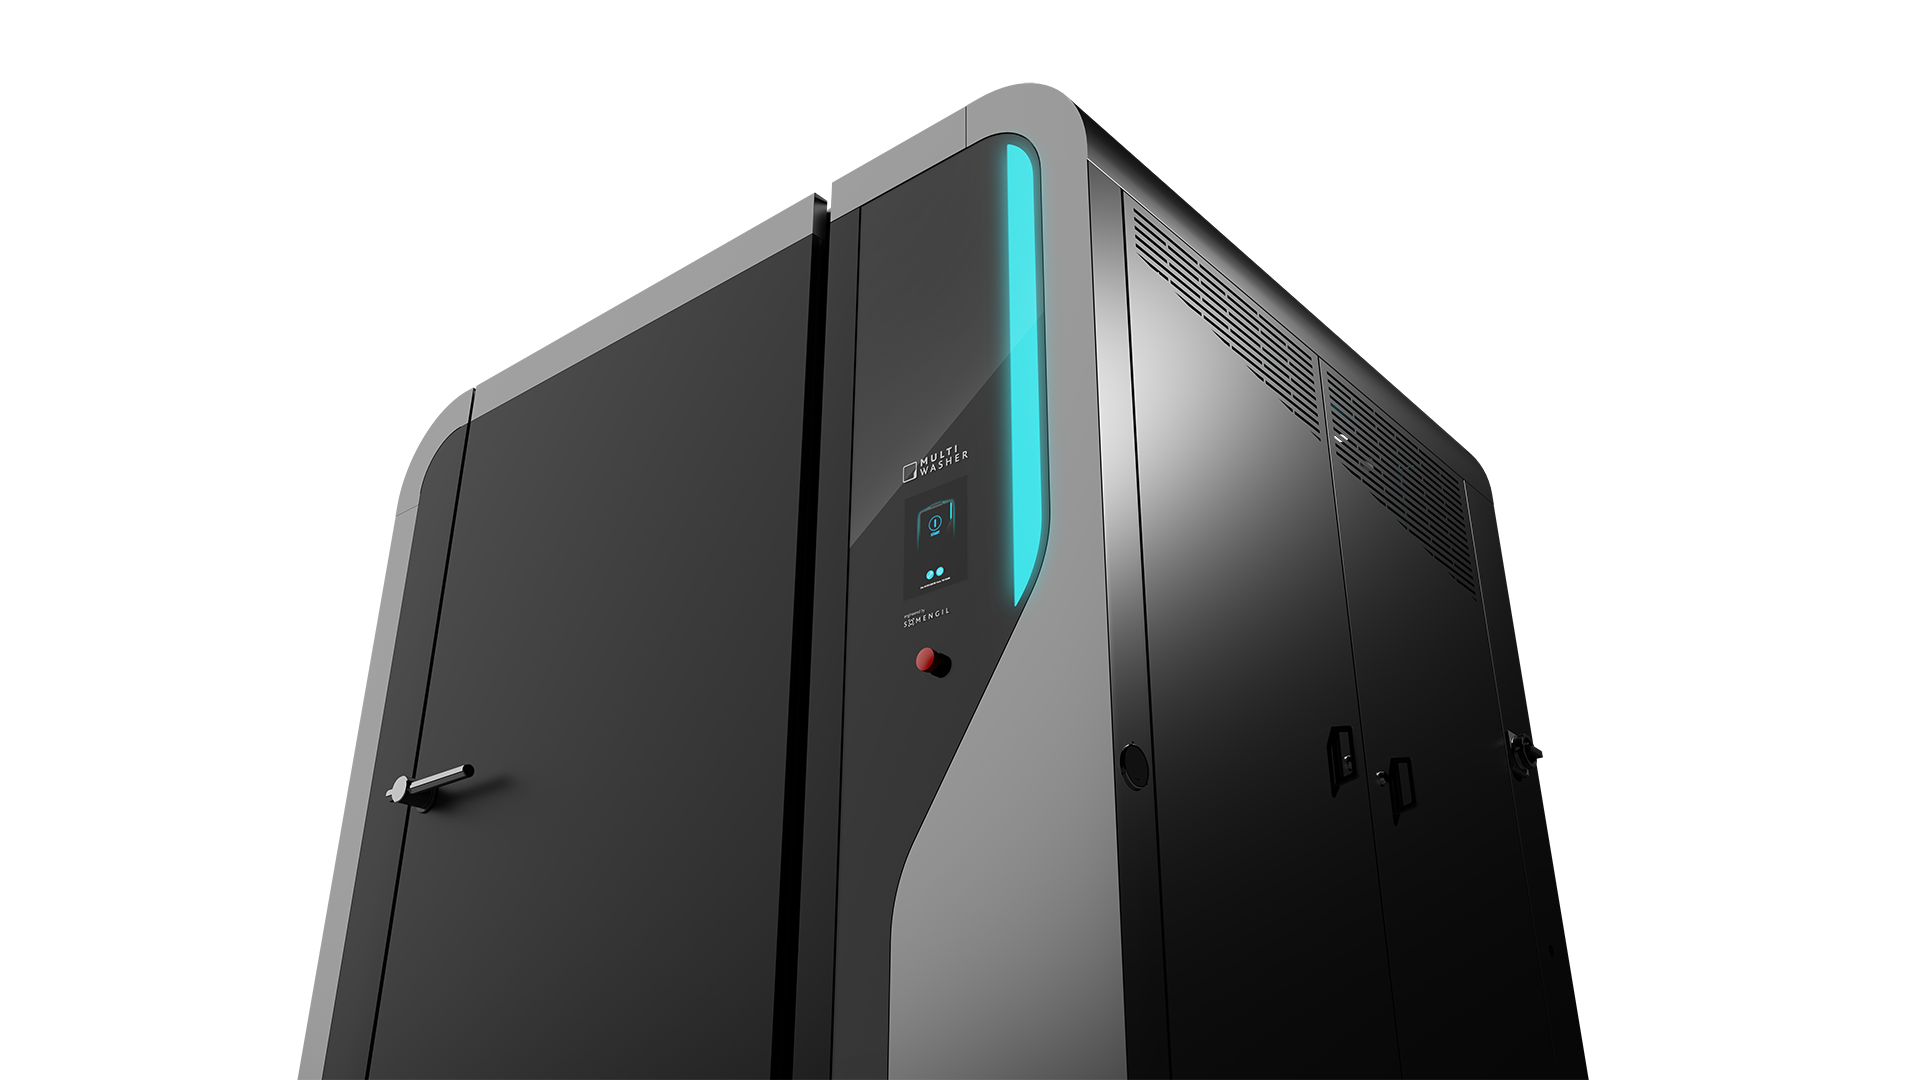
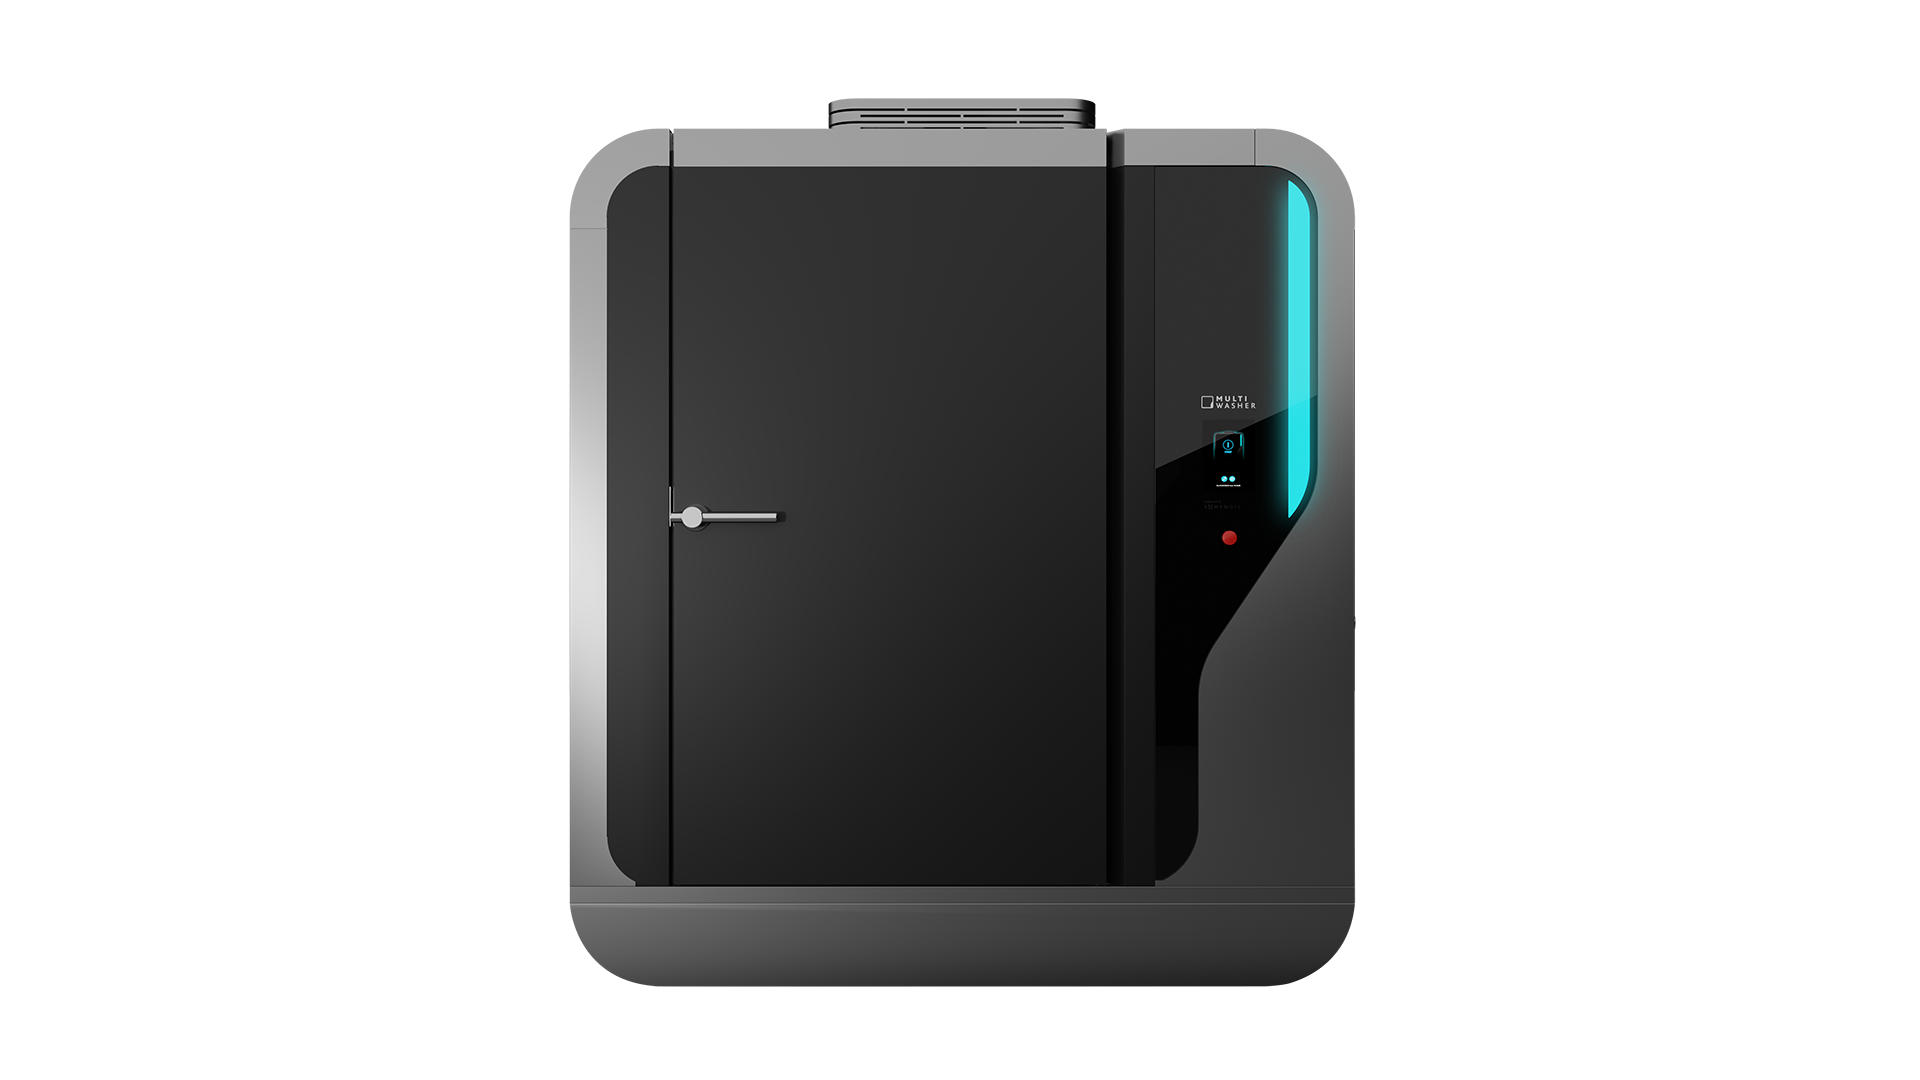
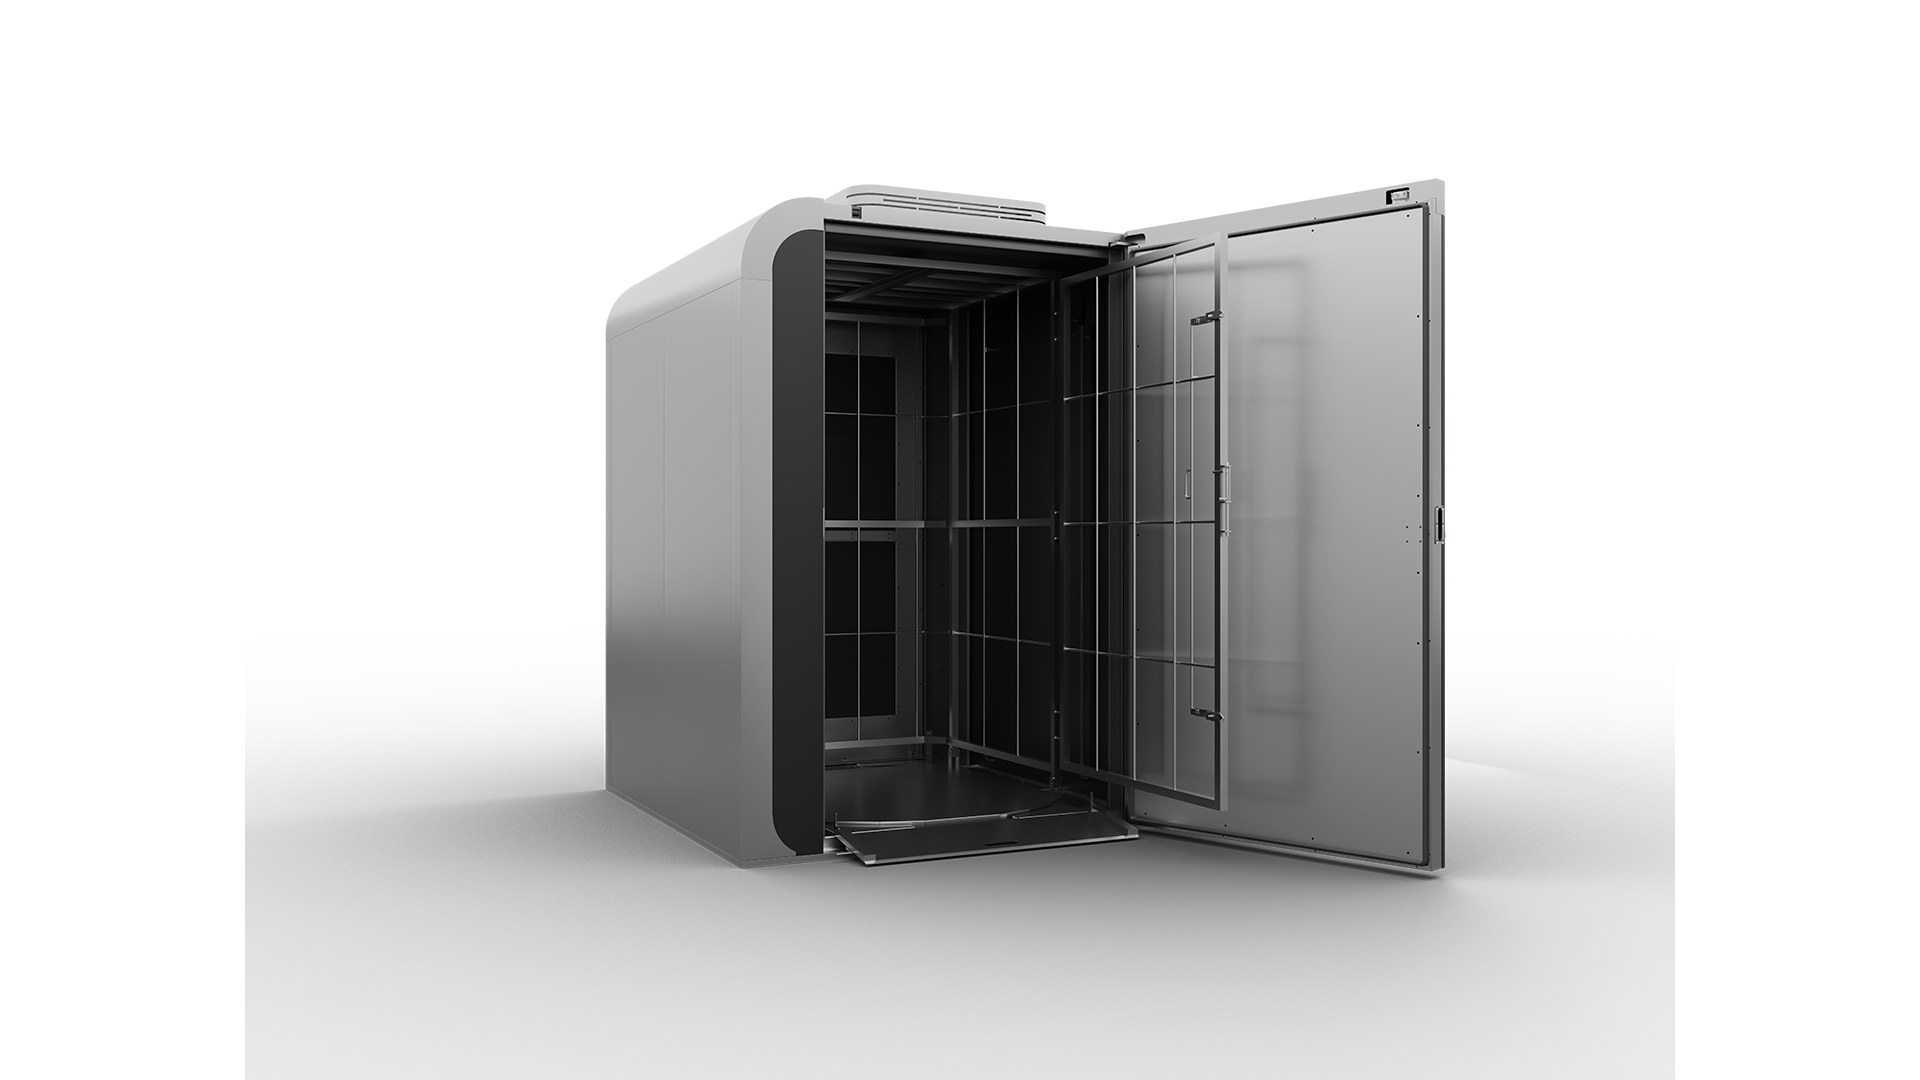
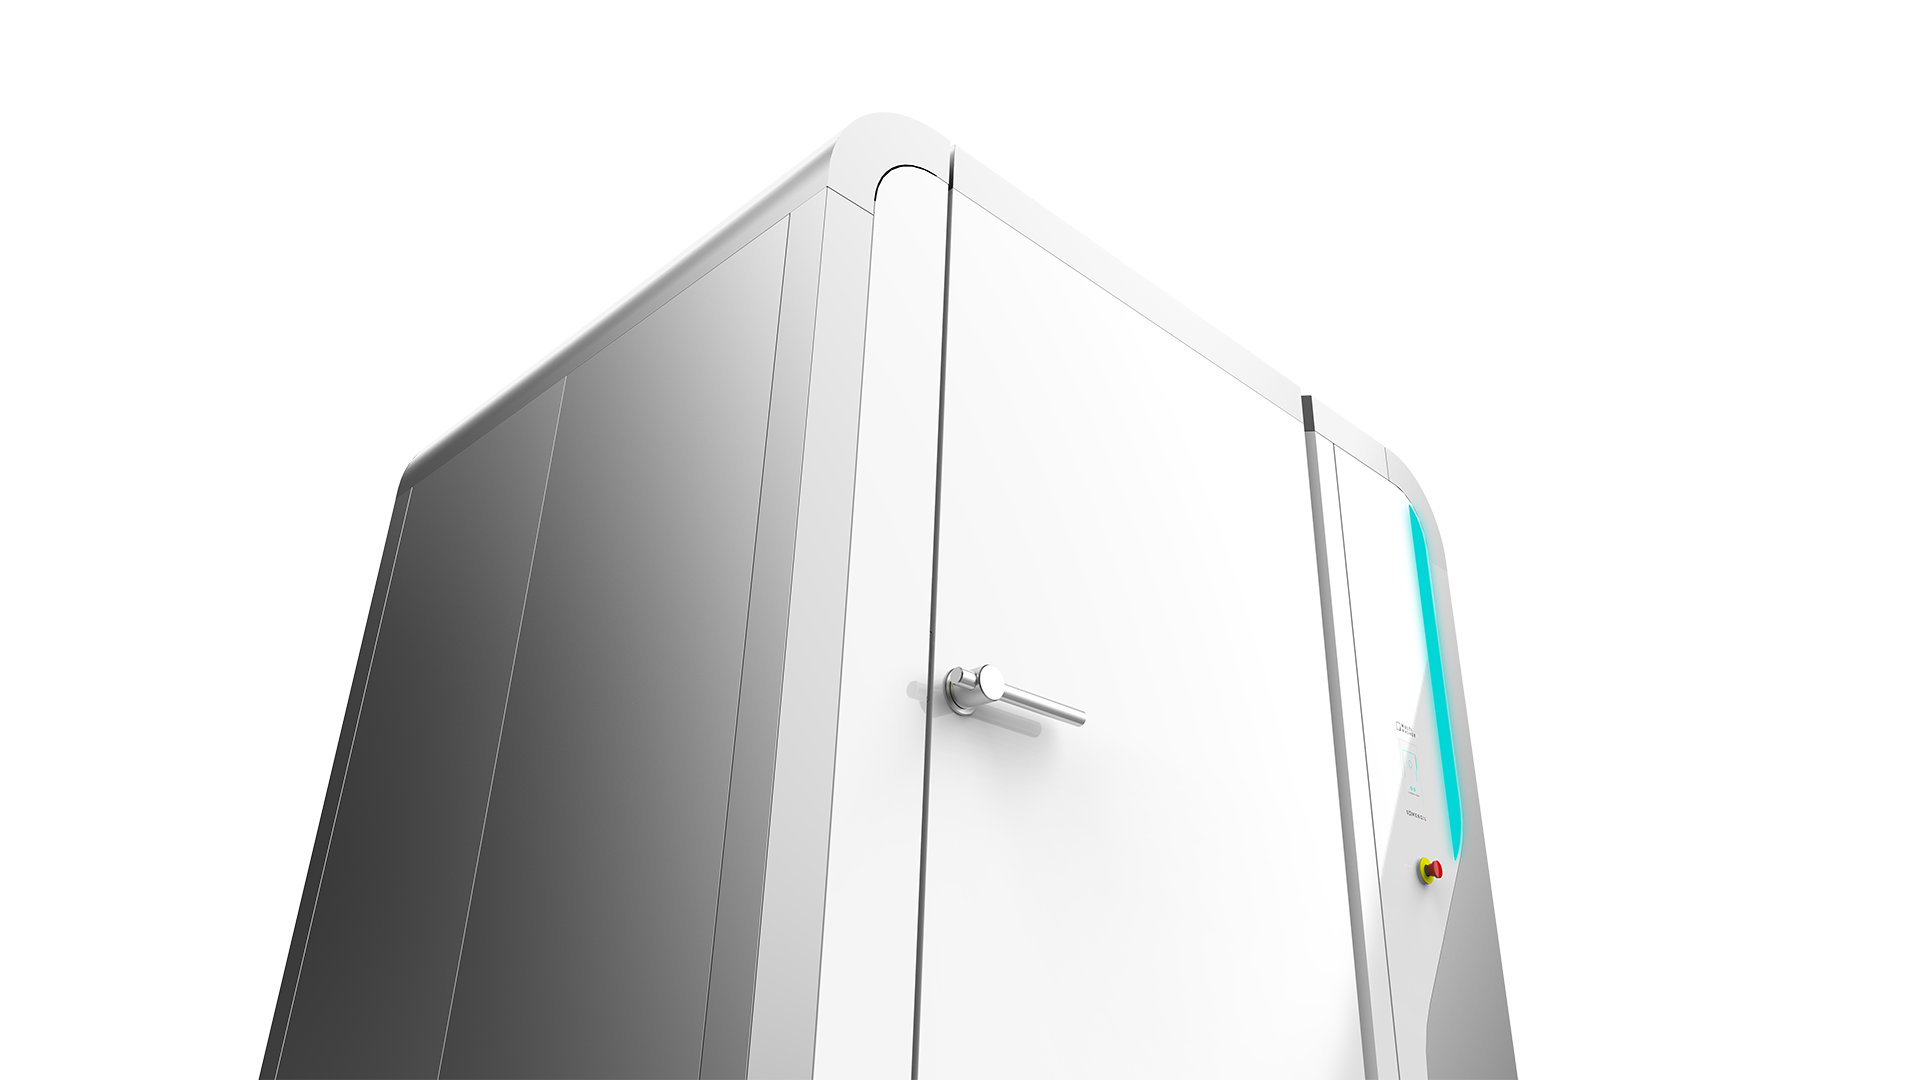
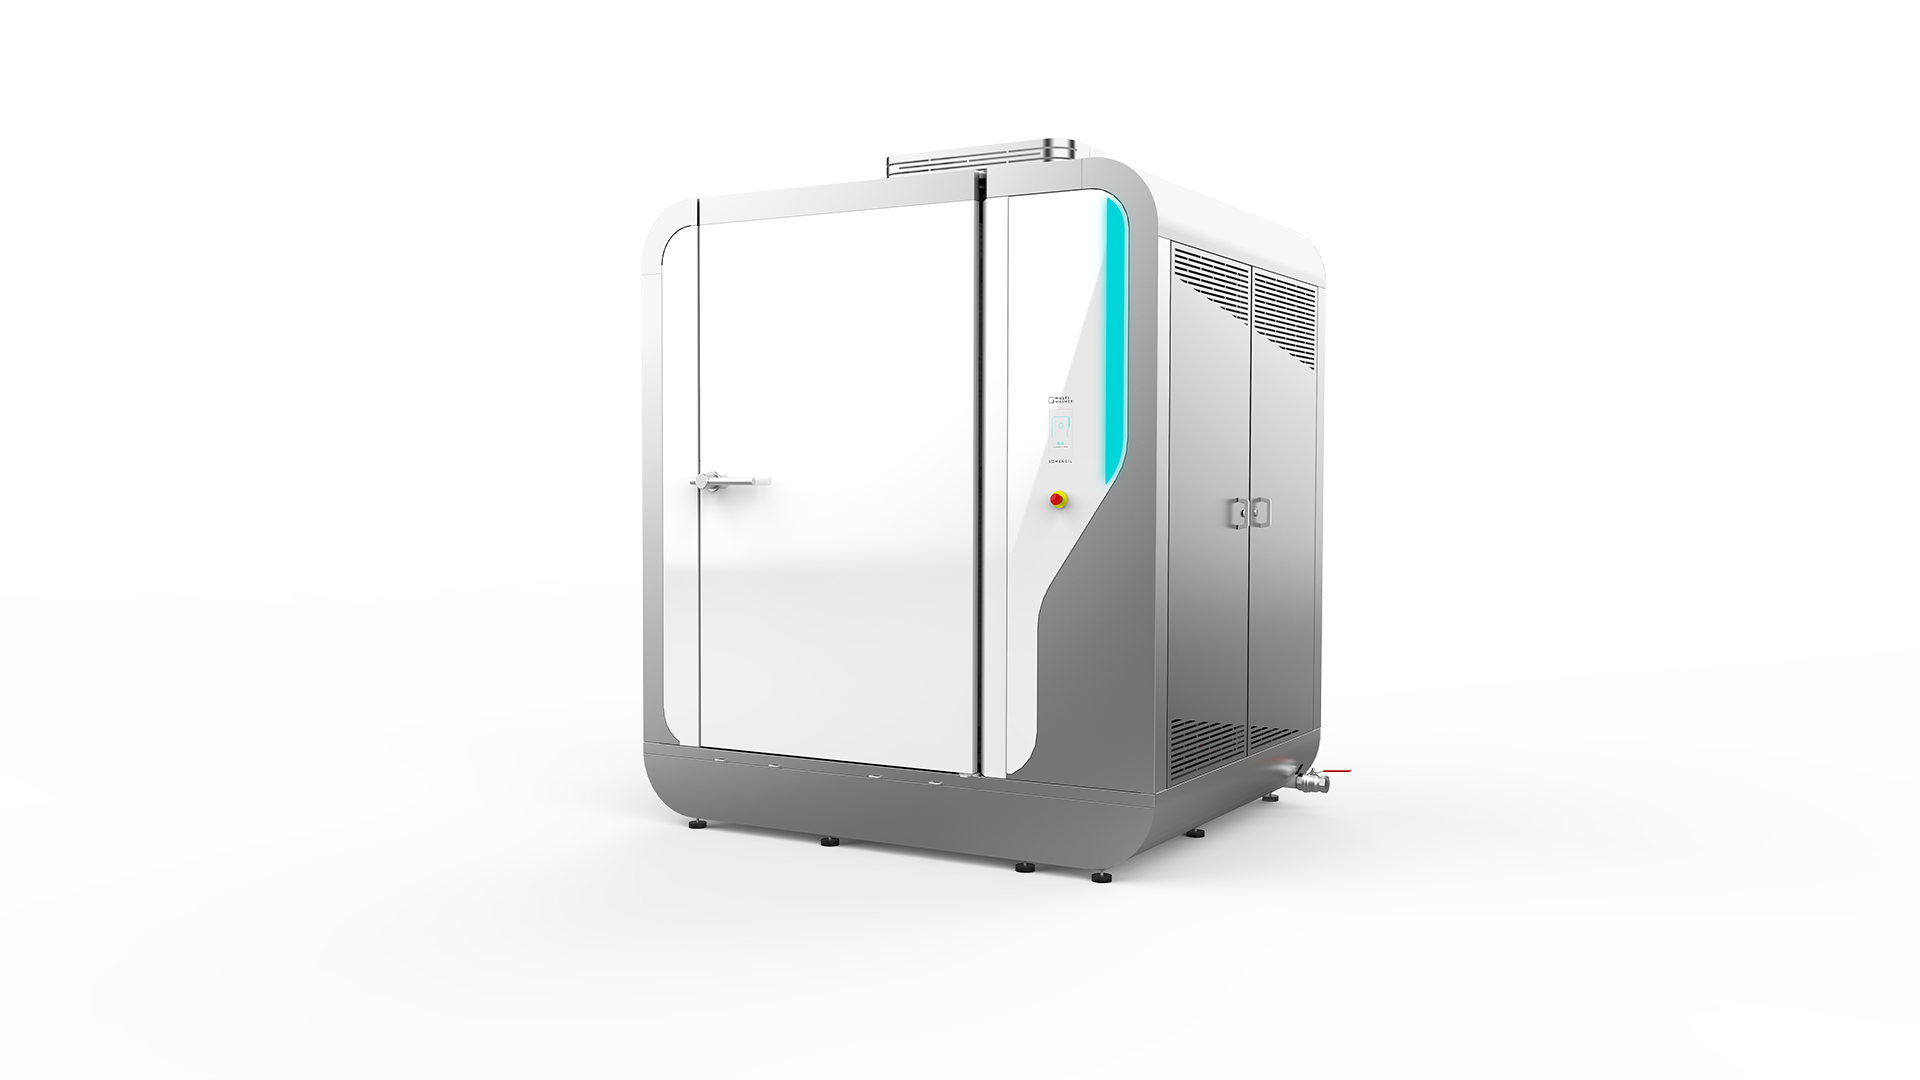
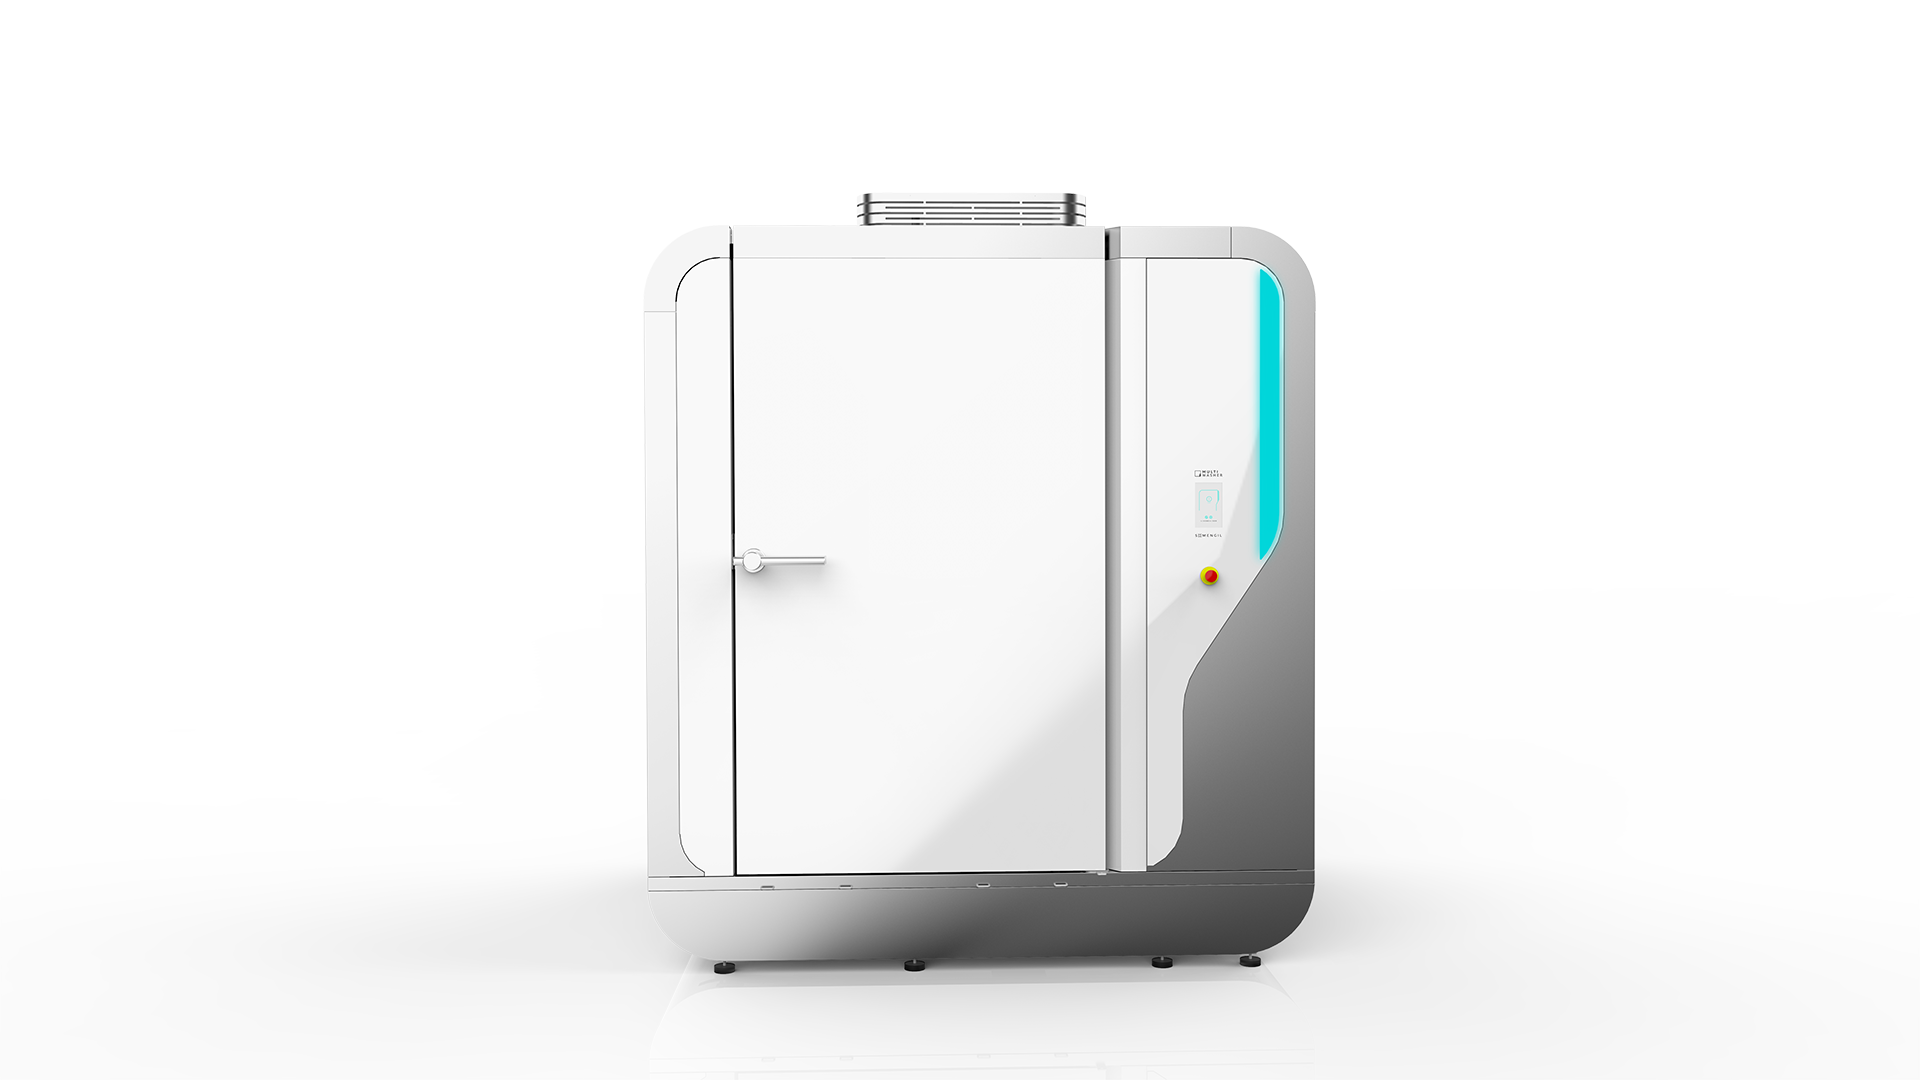
Multiwasher has been designed in a cabinet format, which allows for the complete control of washing processes.
Its state-of-the-art technology ensures efficient and sustainable washing, based on optimized processes that not only guarantee disinfection, but also save energy and resources.
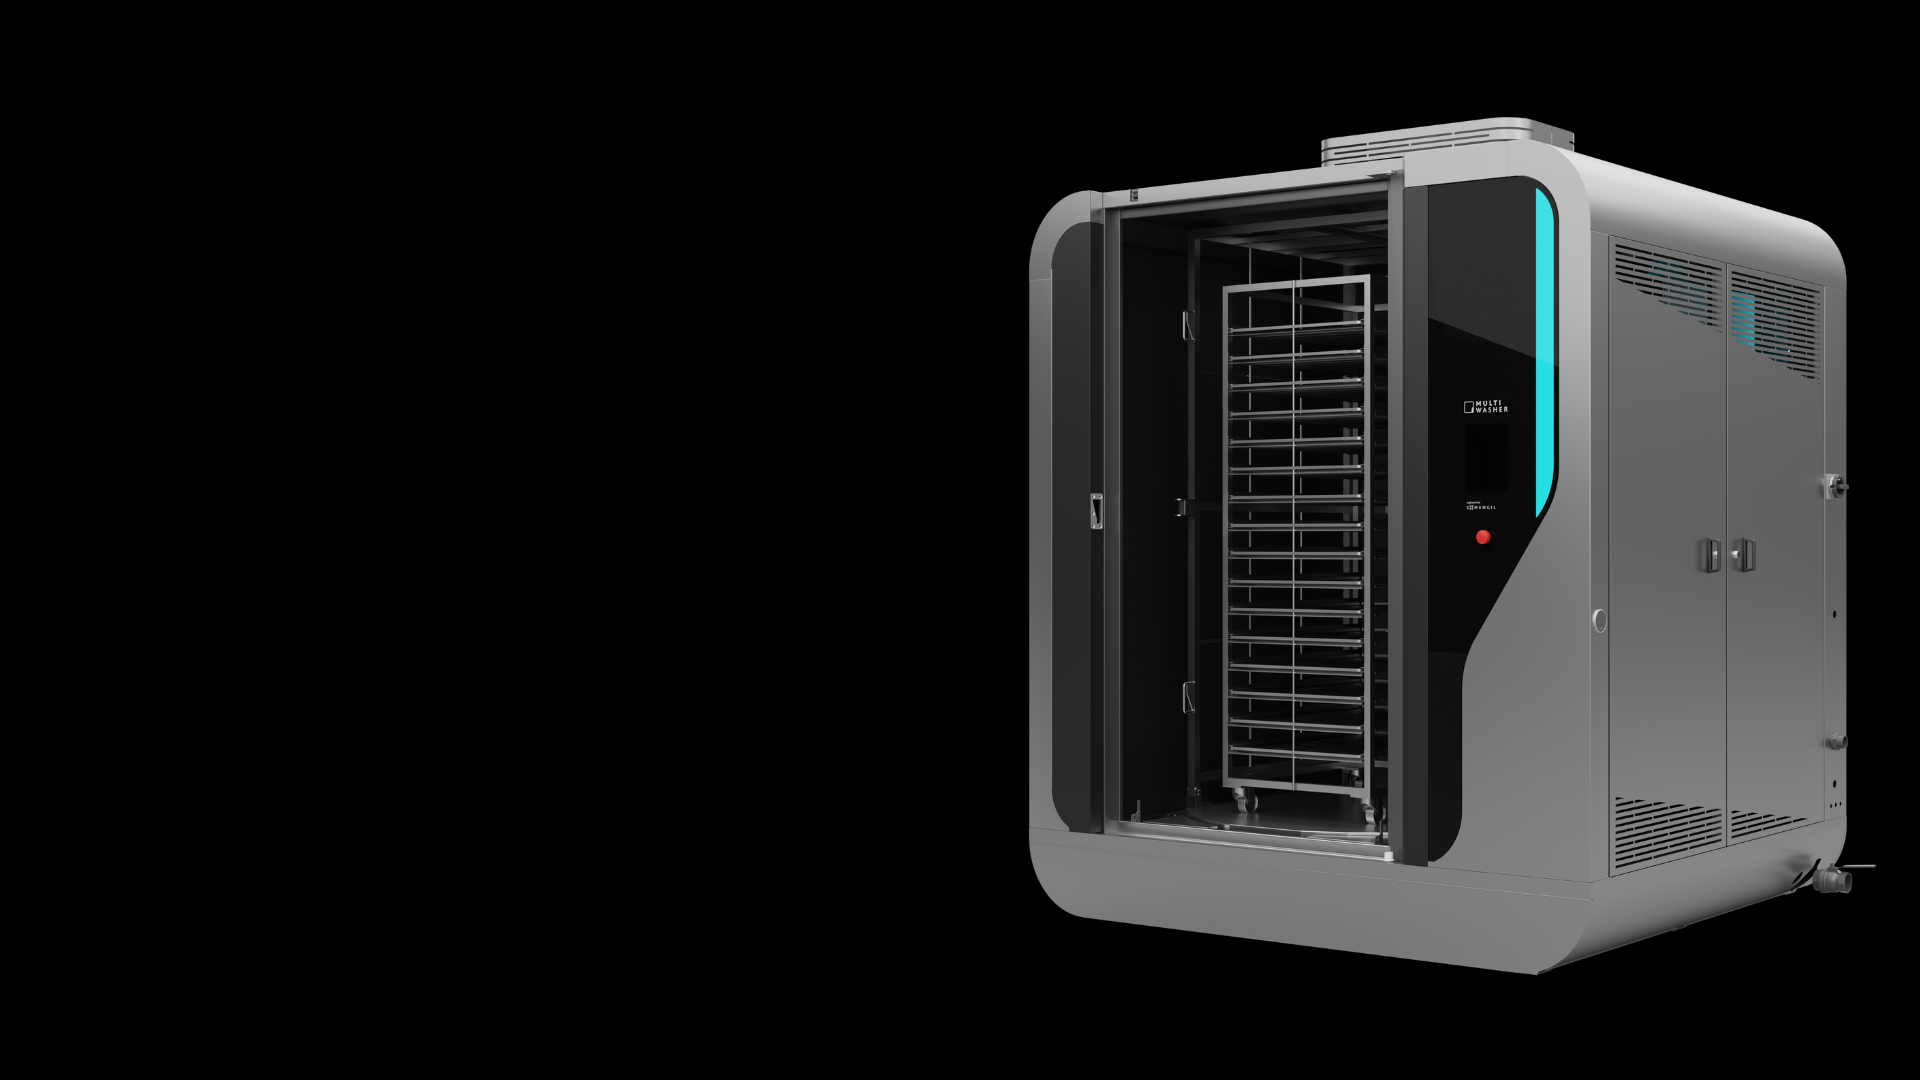
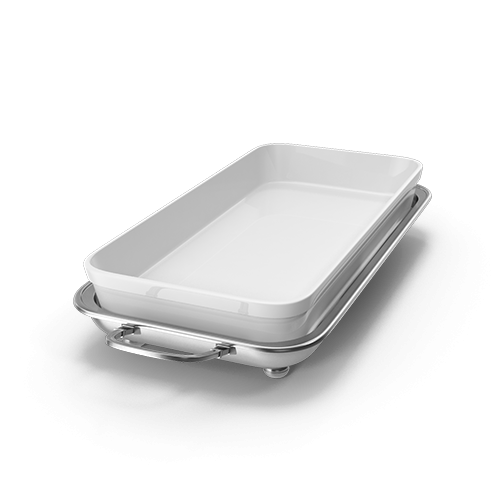
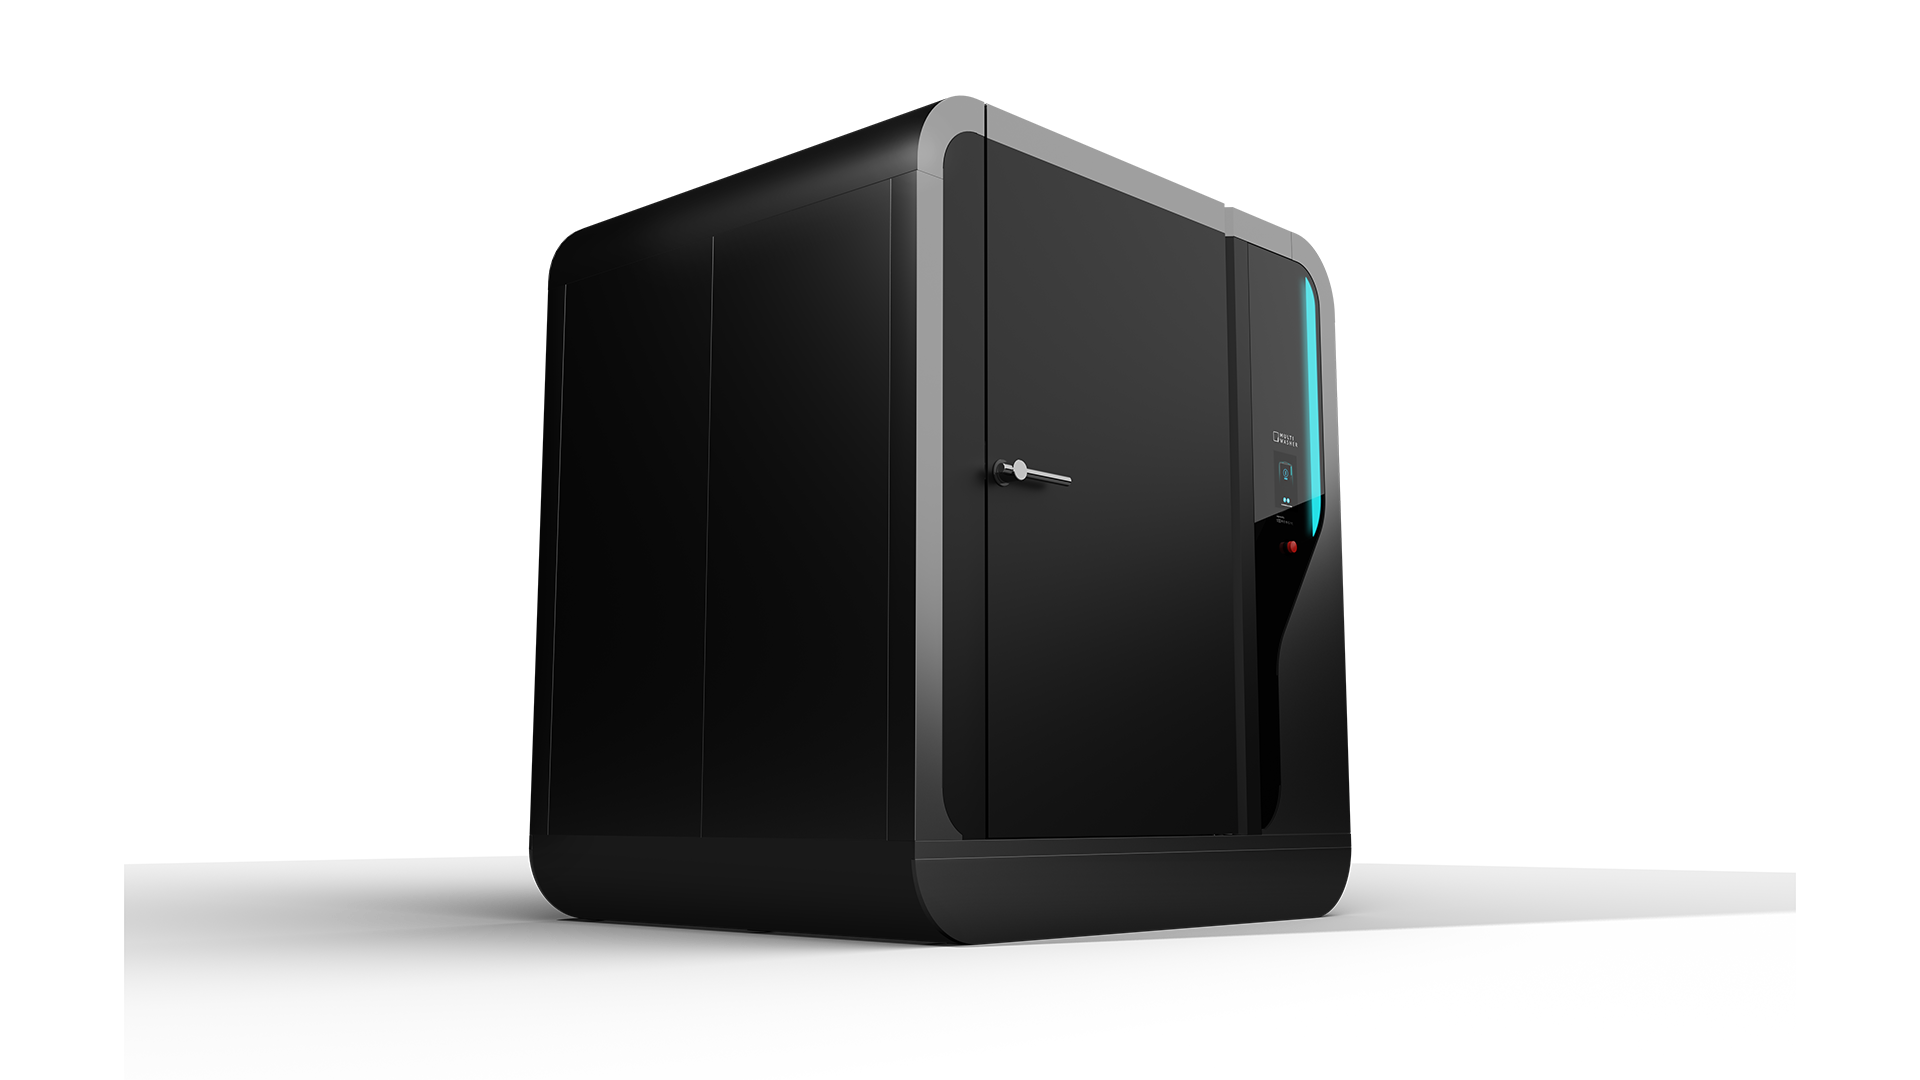
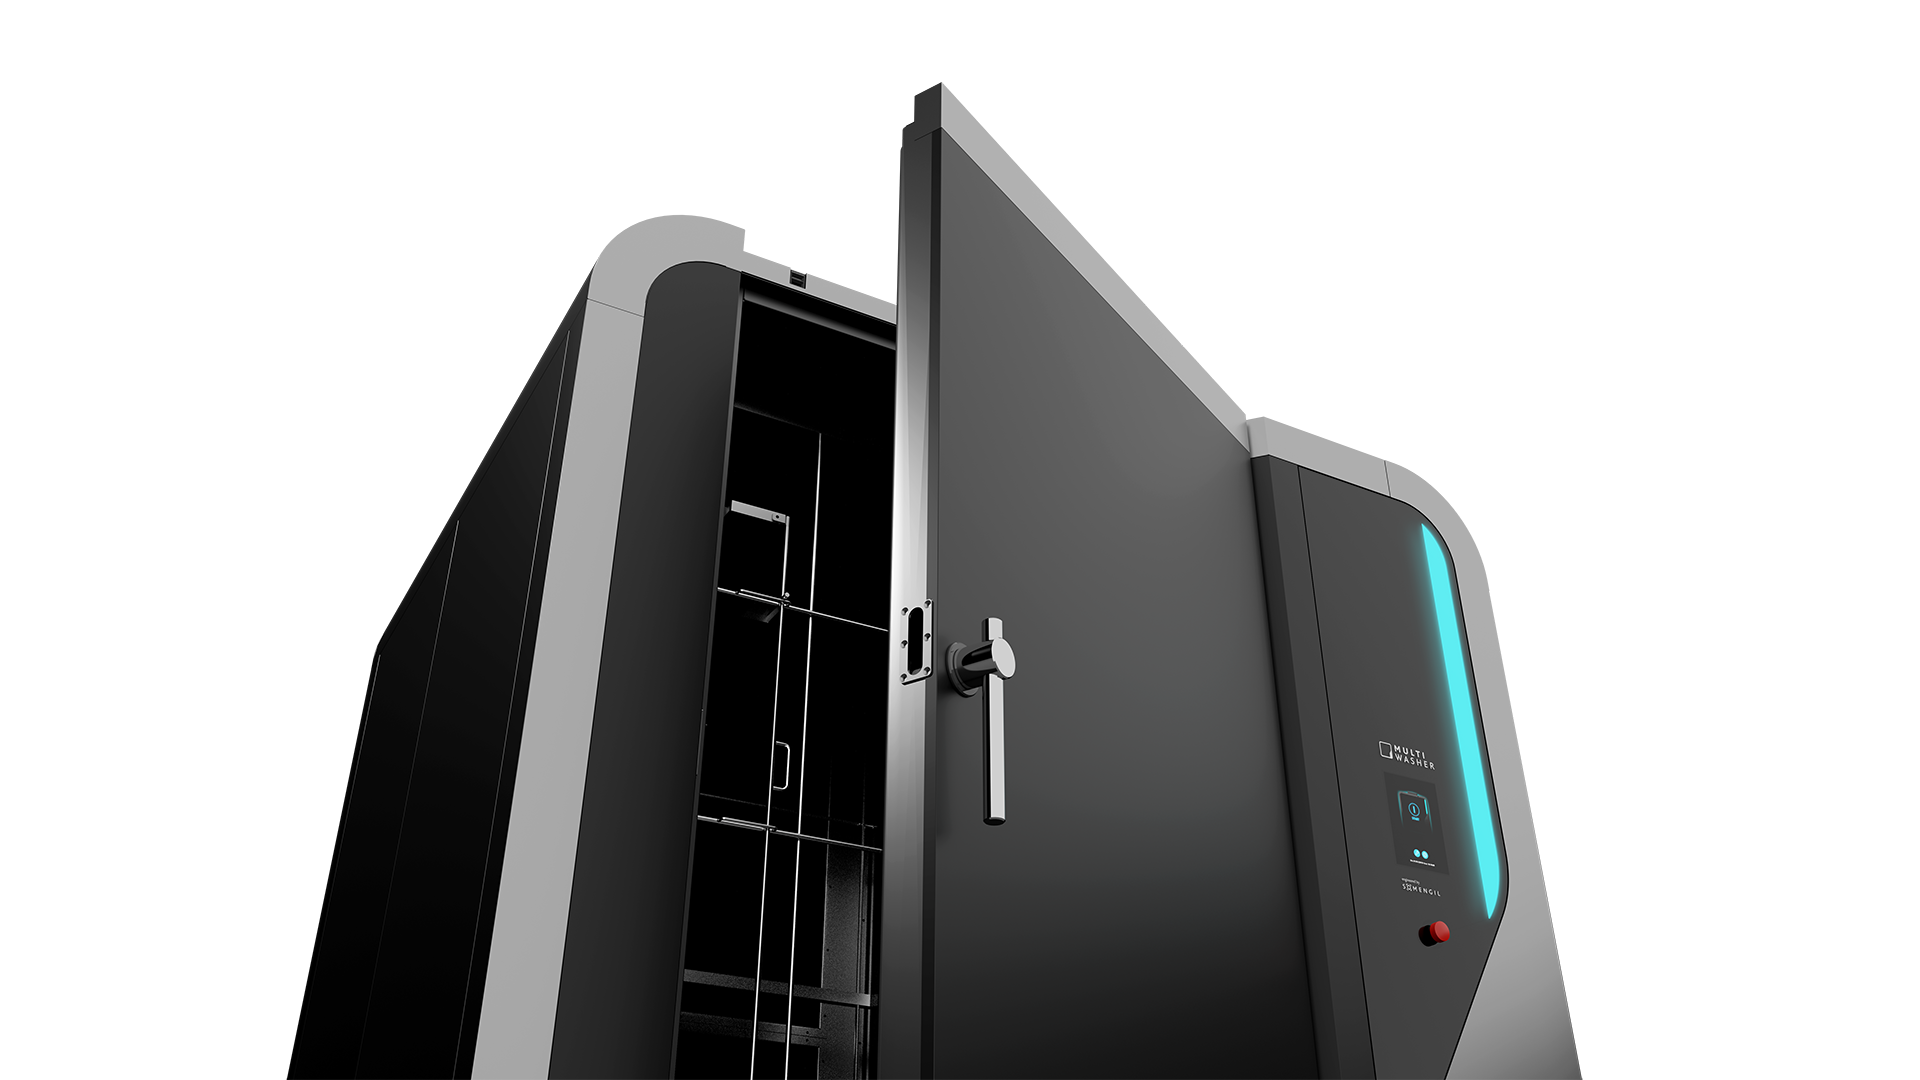
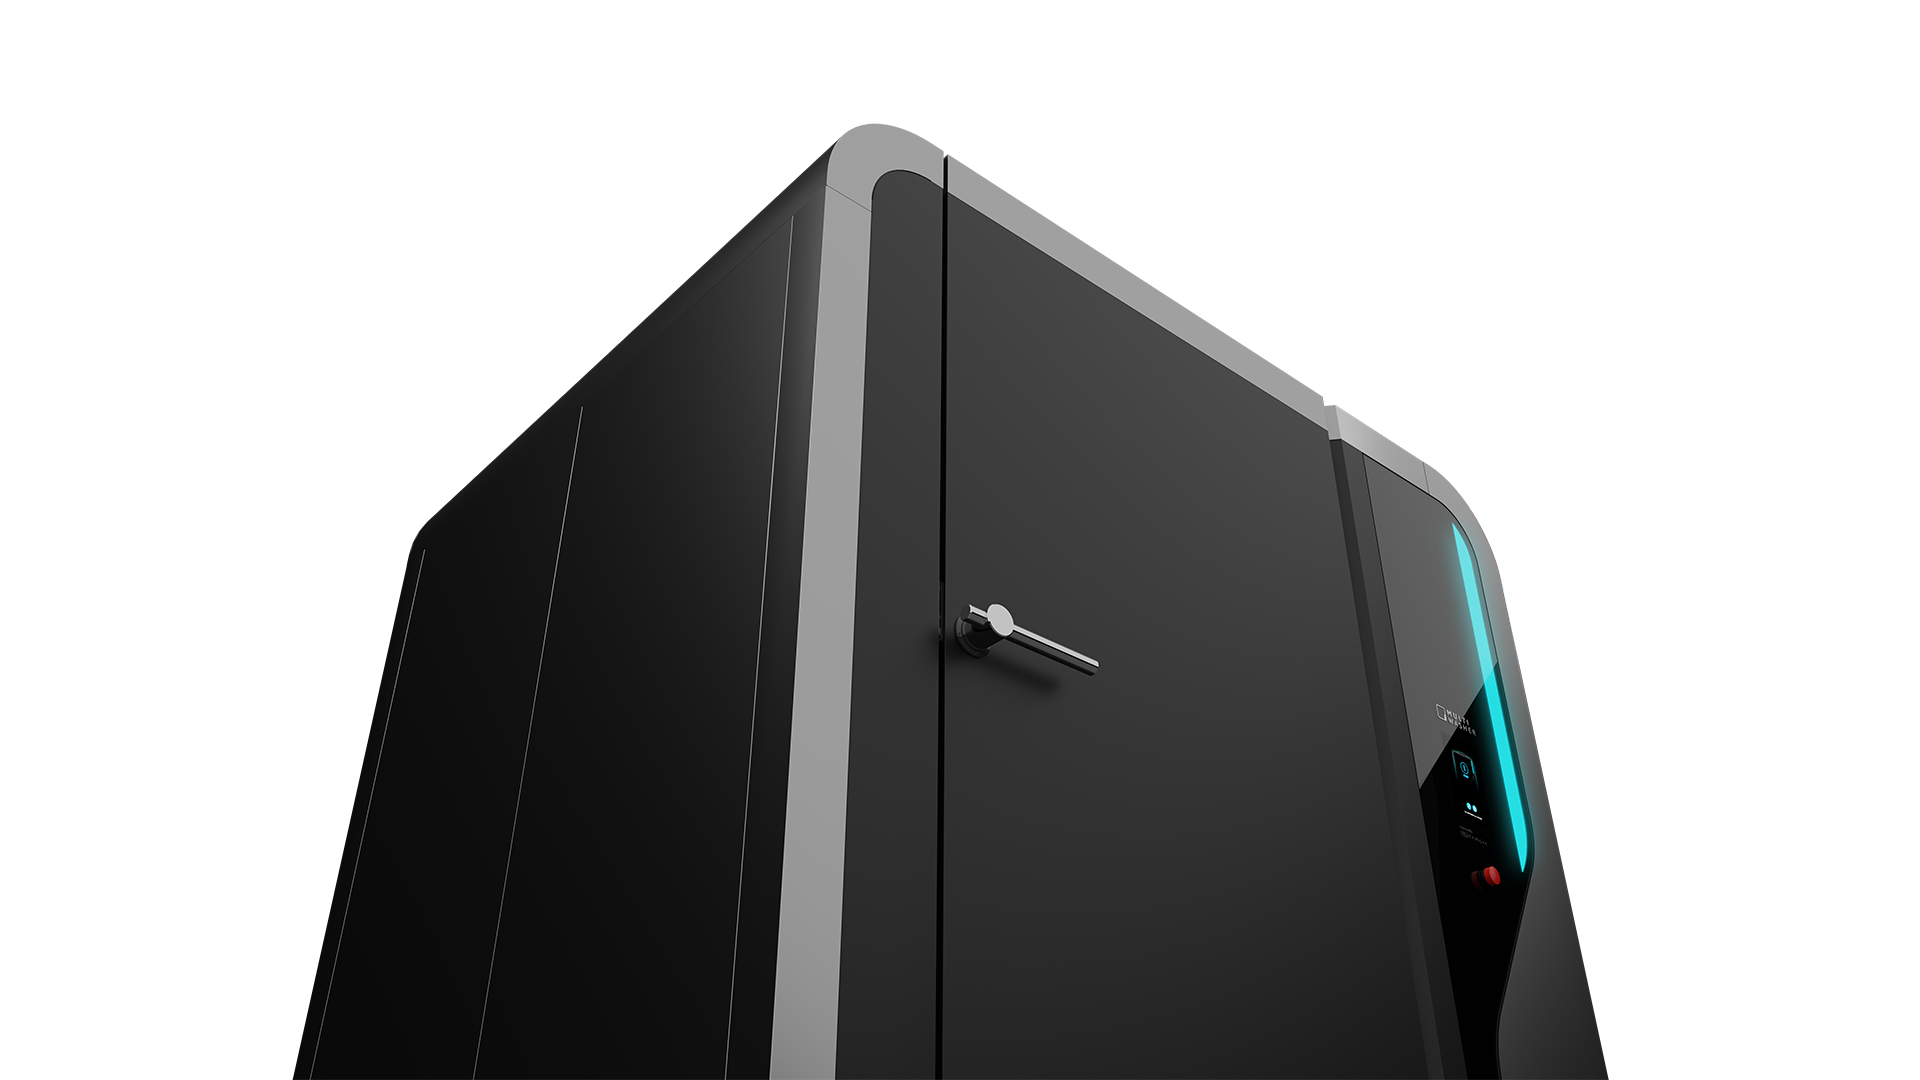
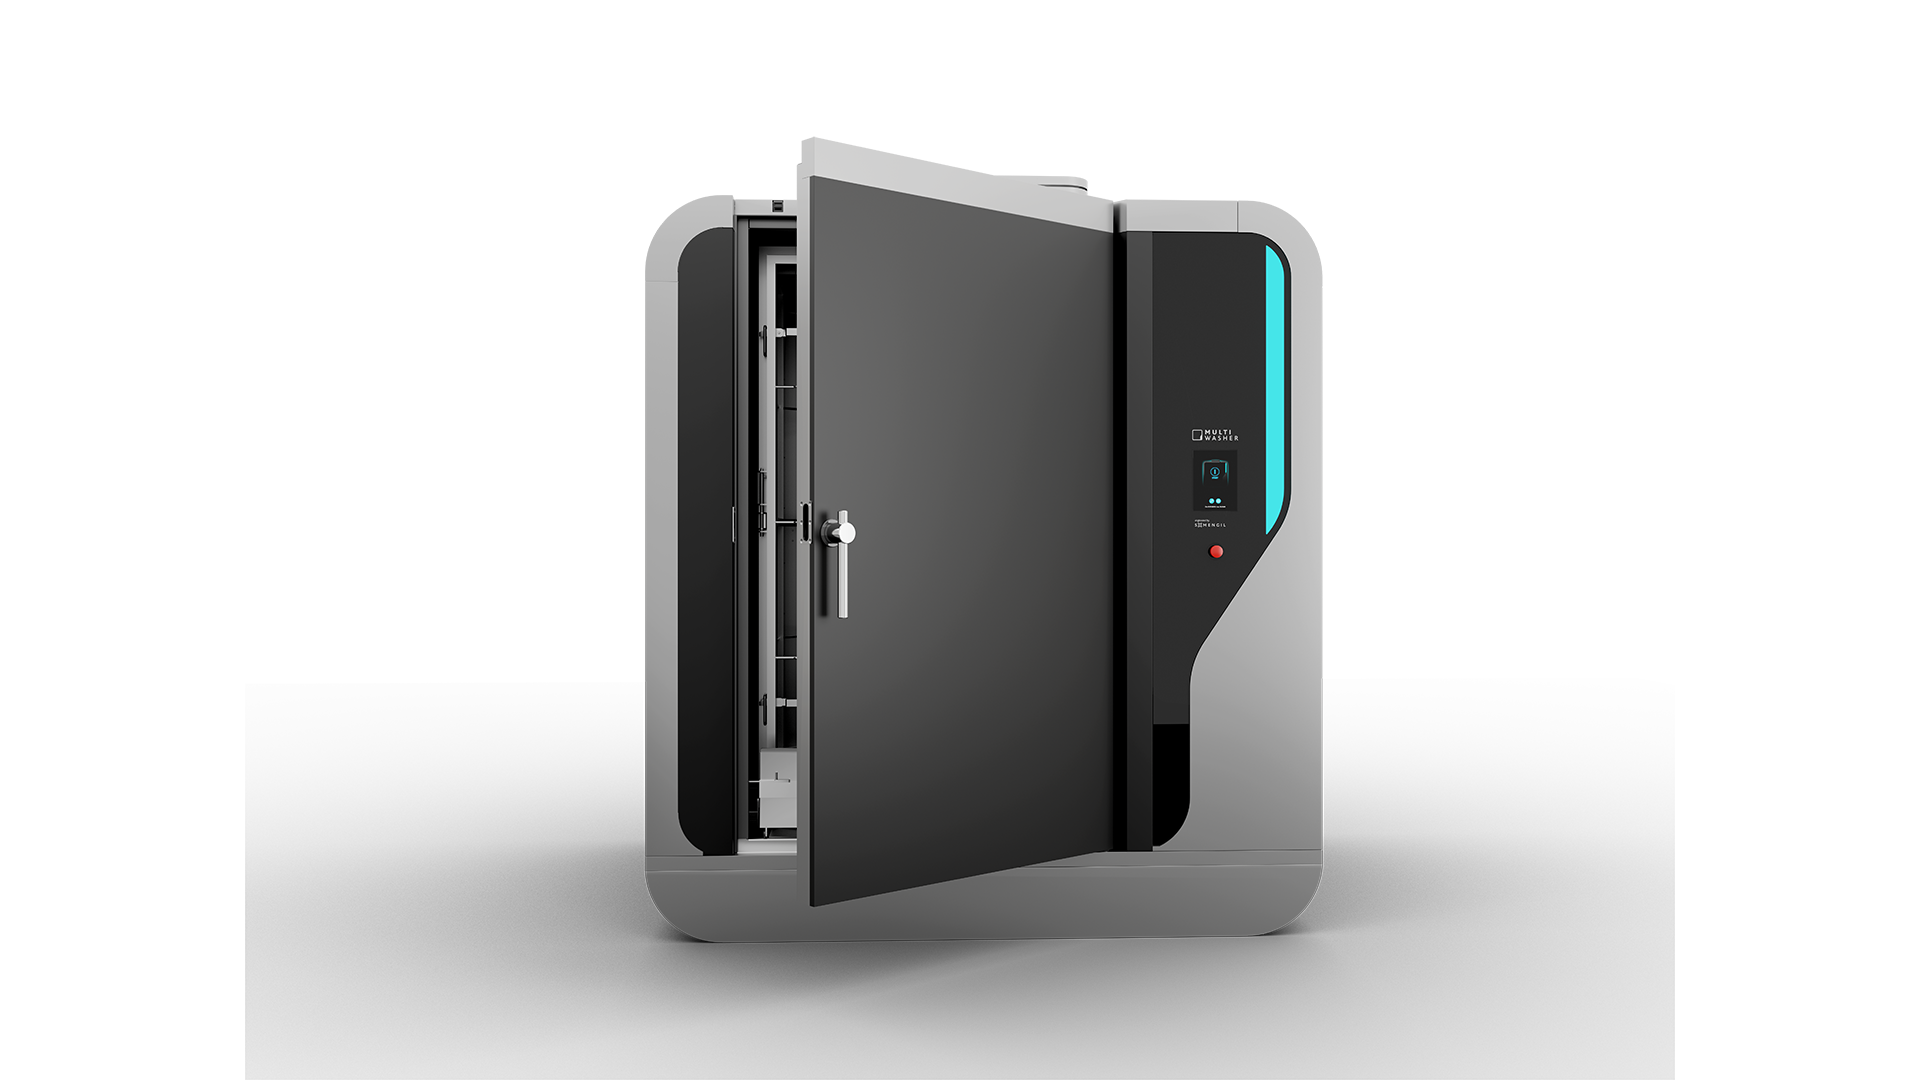
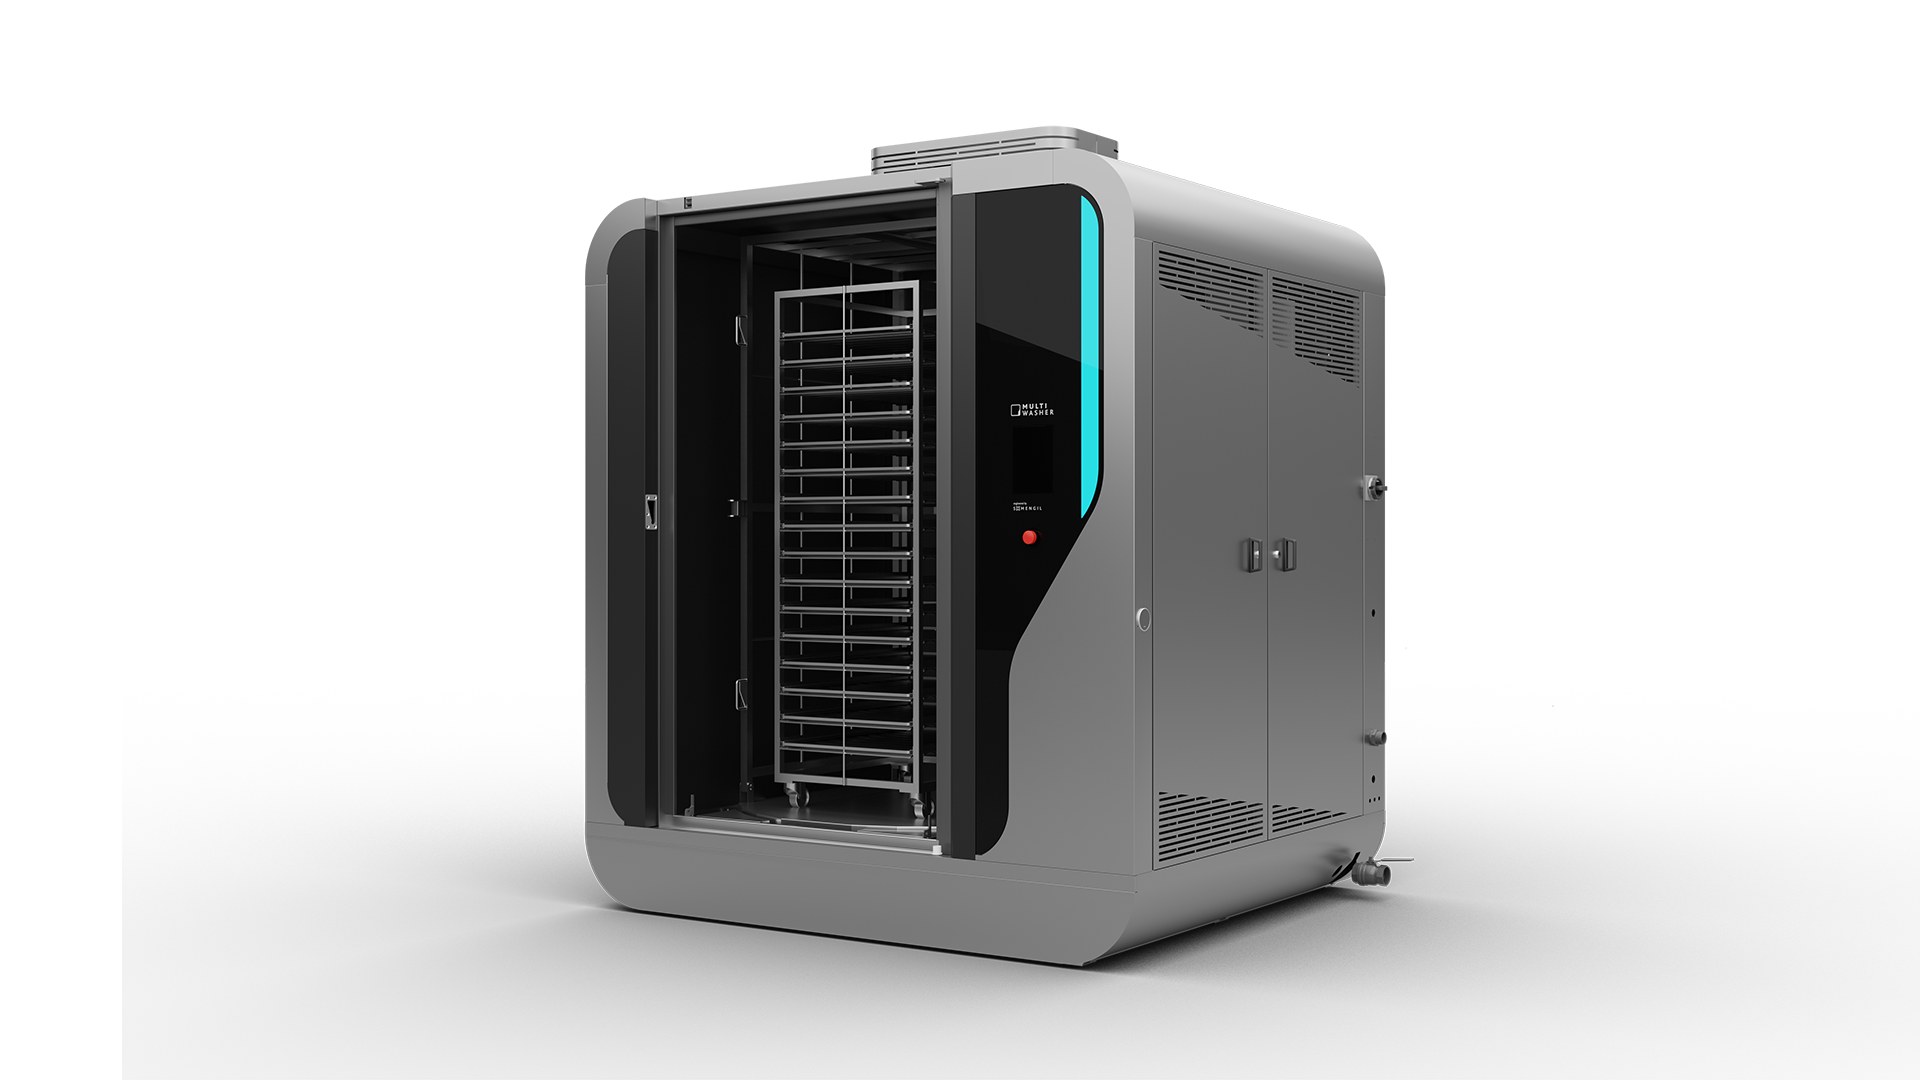
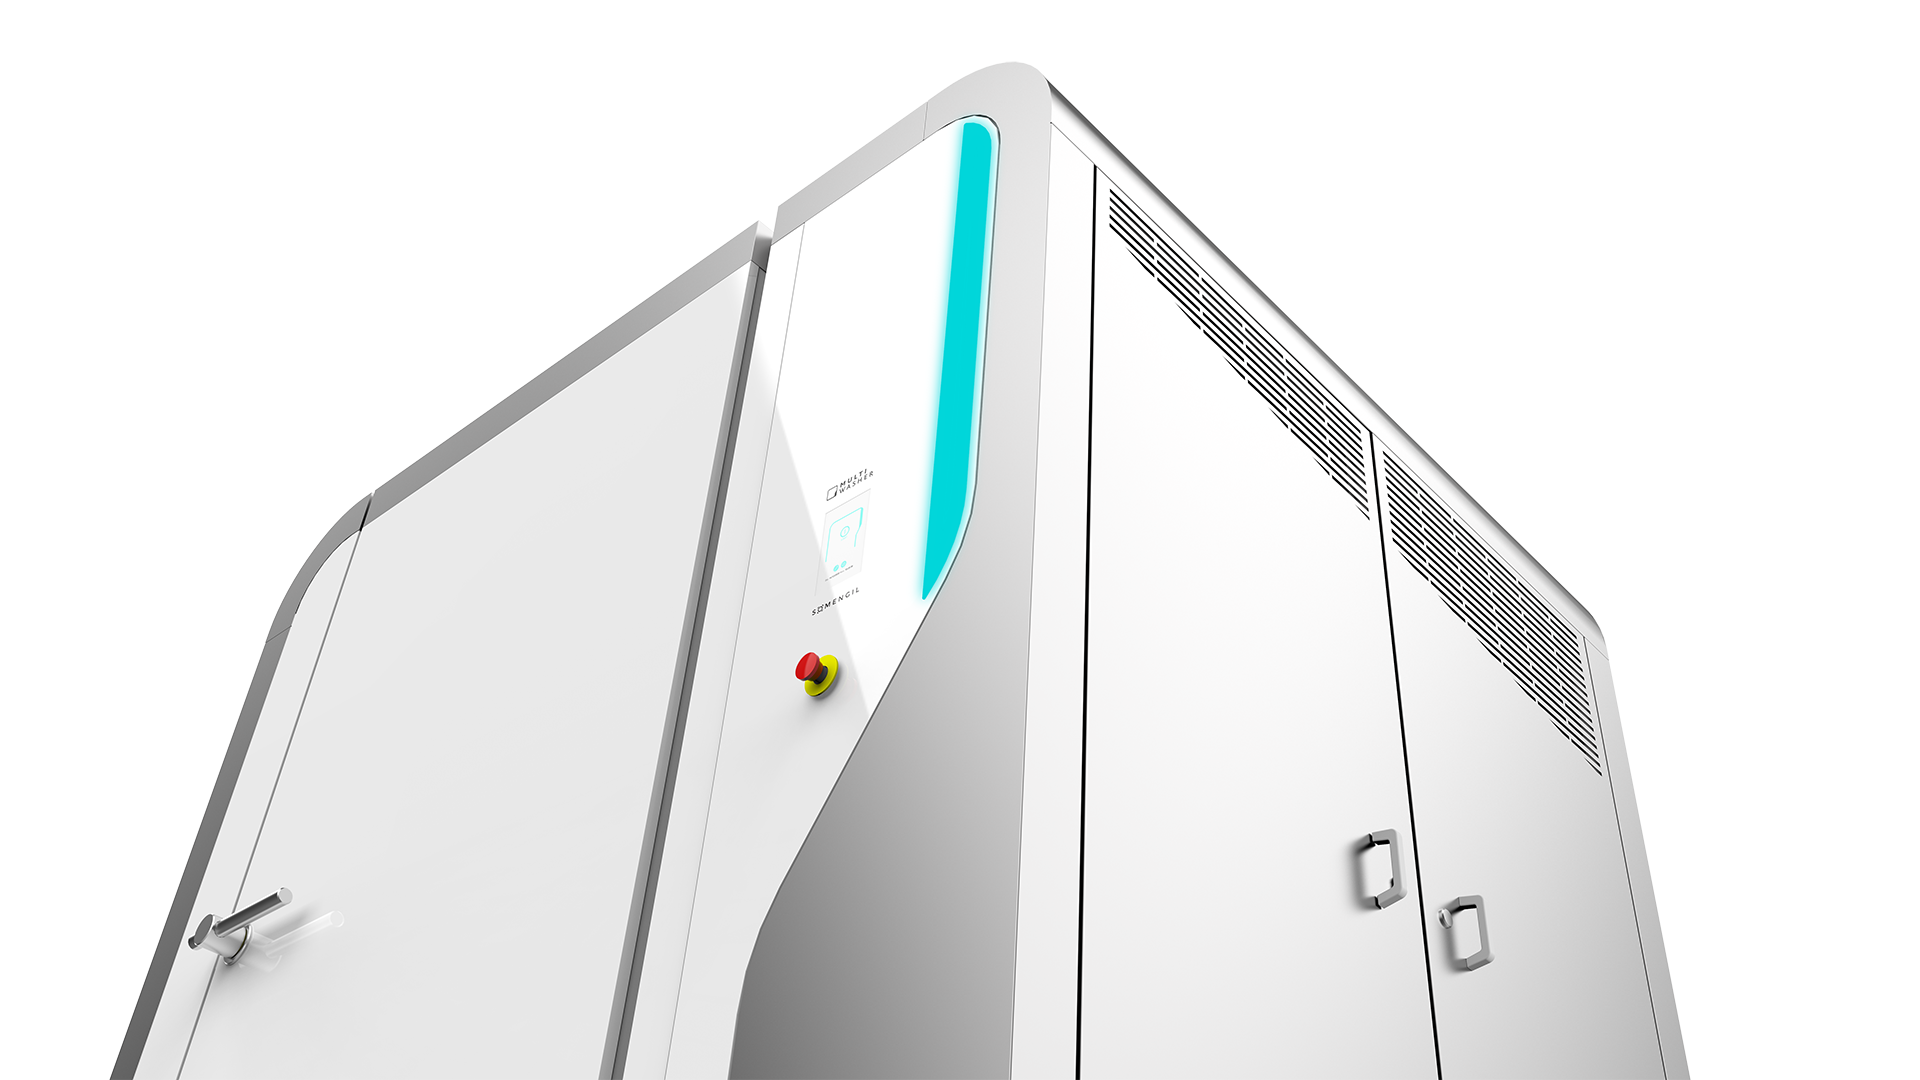
Design and versatility
Multiwasher's versatility allows it to develop customizable solutions tailored to each customer. Various utensils and objects can be integrated into a single wash, allowing for greater flexibility.
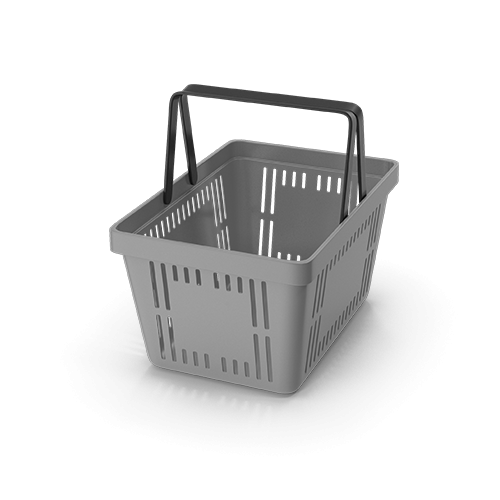
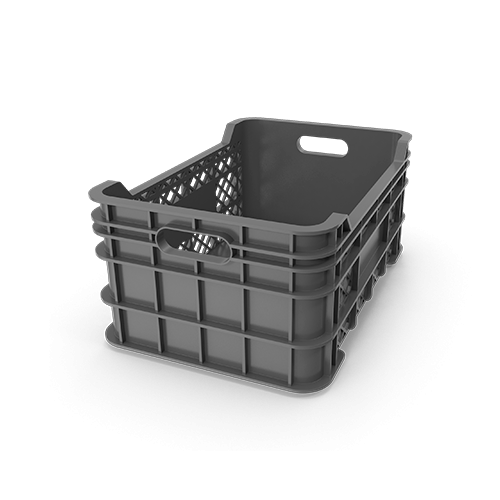
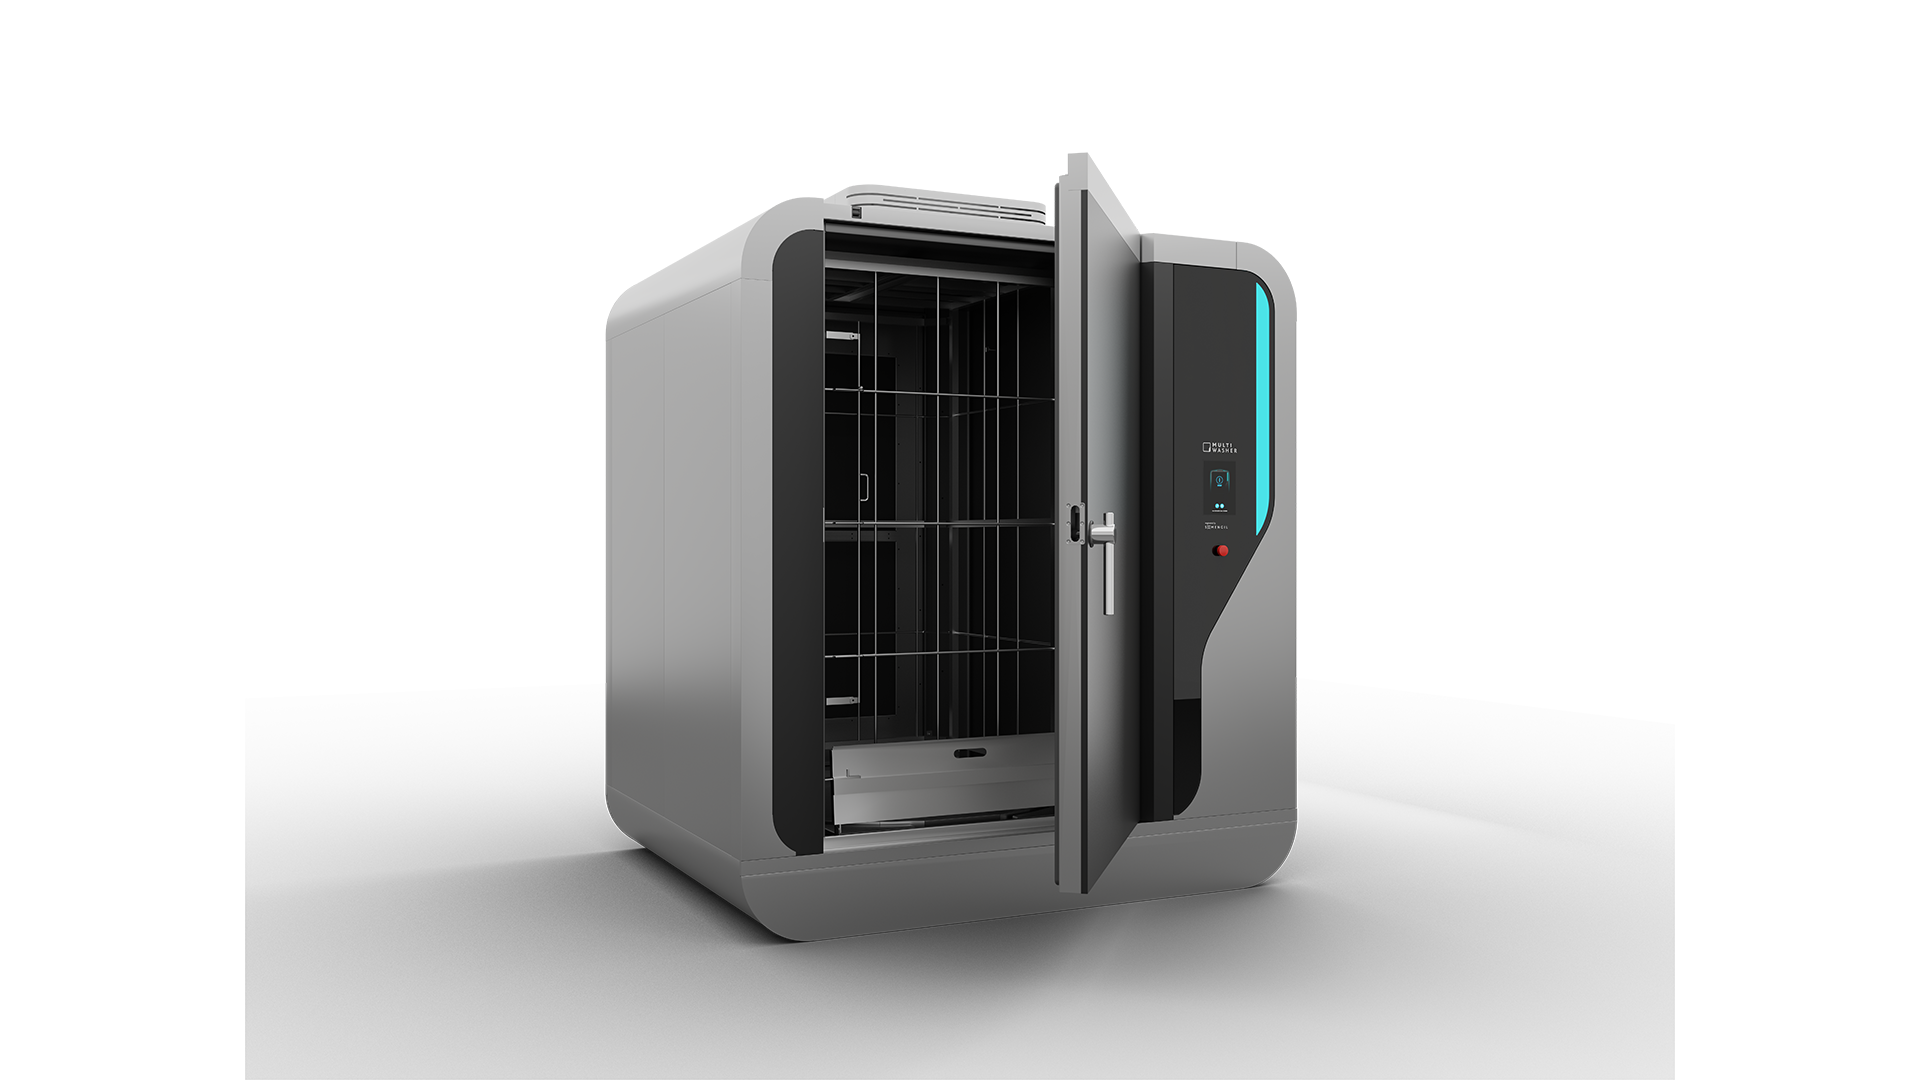
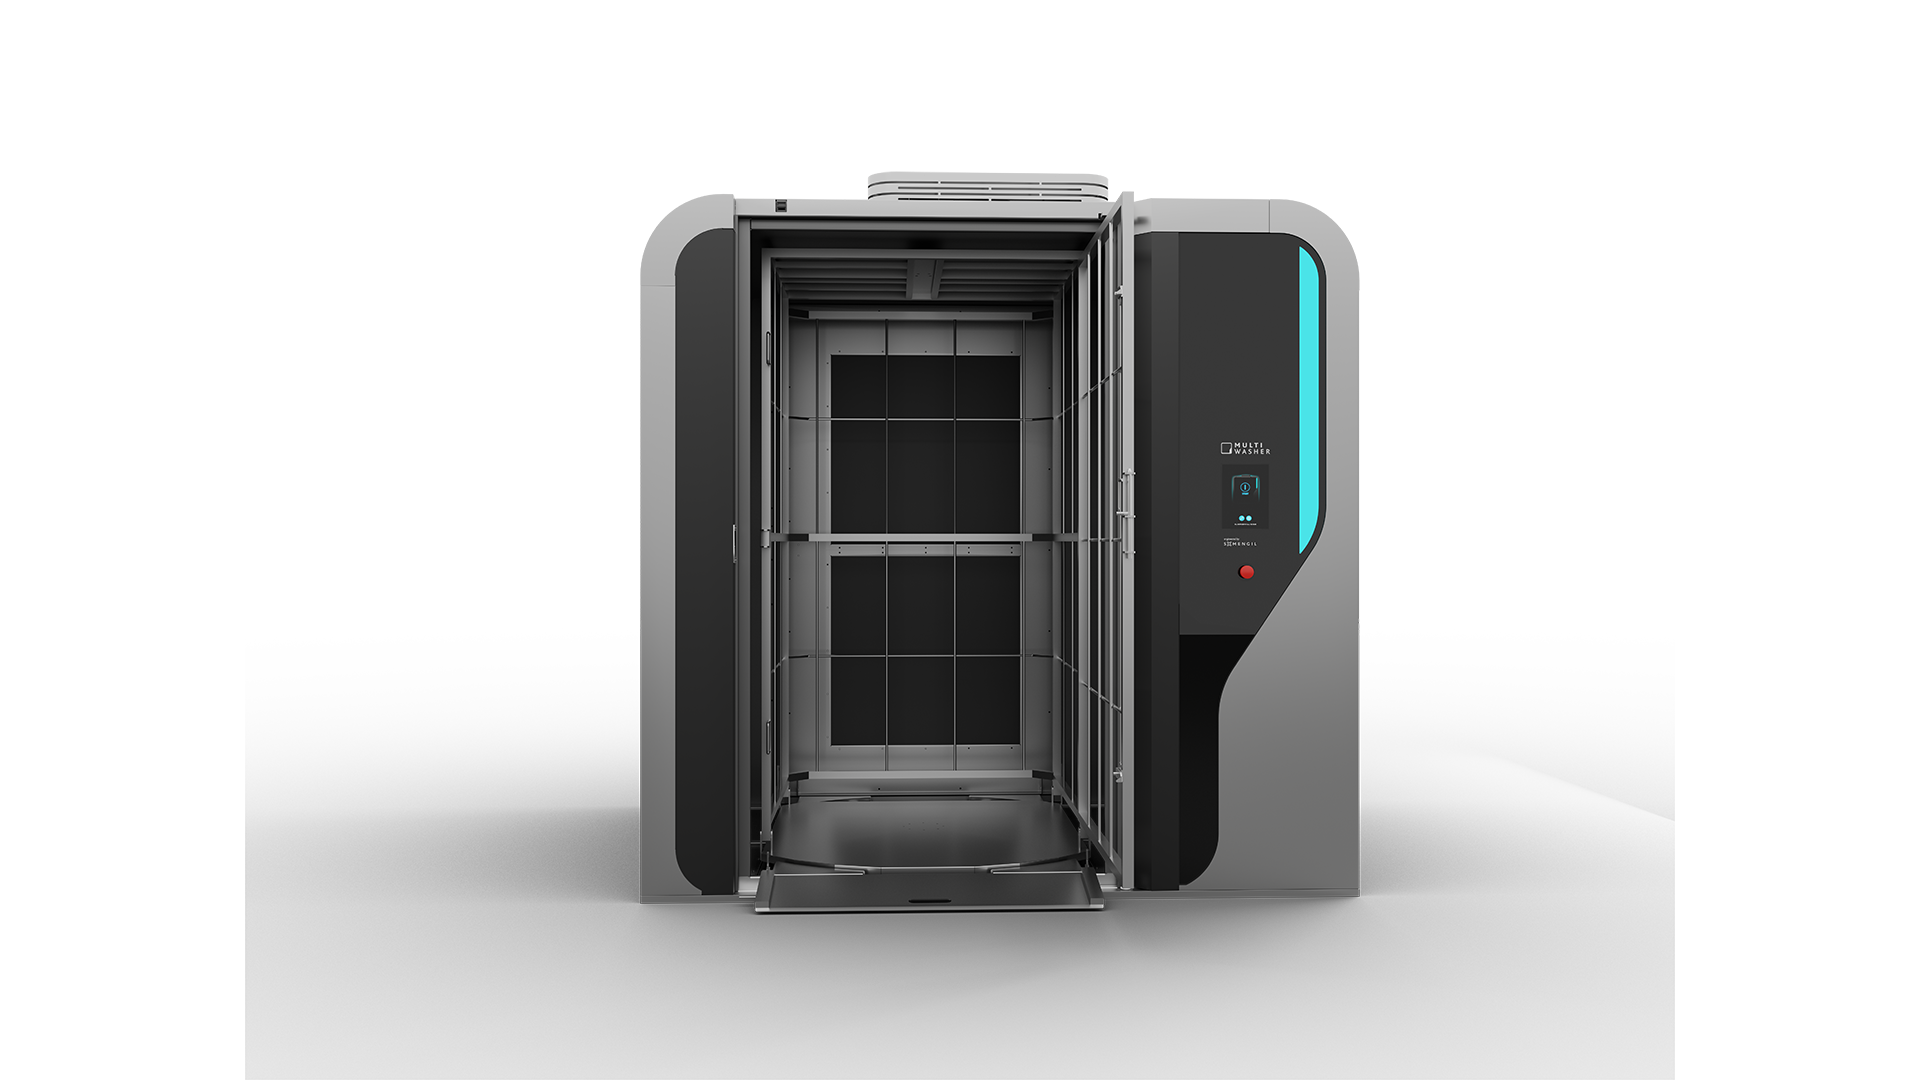
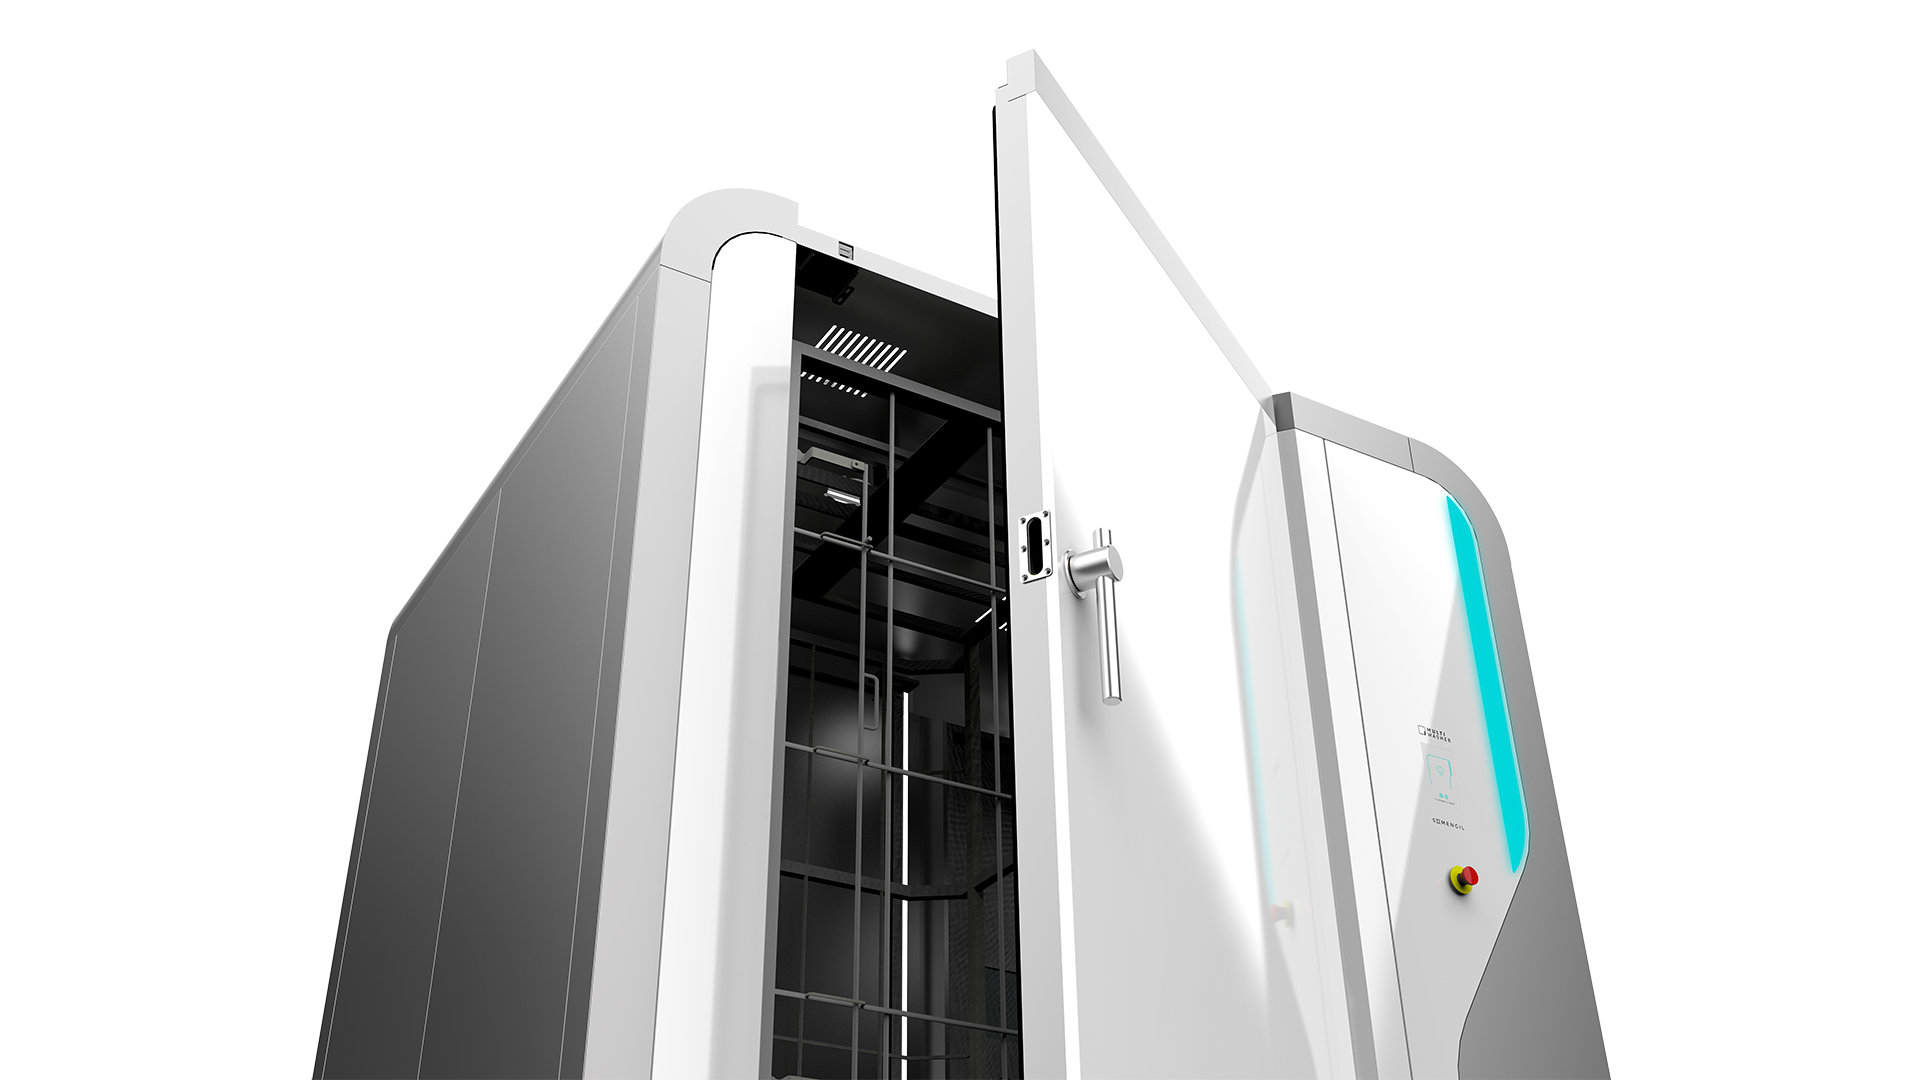
Multiple industries
Multiwasher was developed to be an effective washing solution for any industry. Thanks to a system of trolleys and programs tailored to what you need to wash, we guarantee quality and optimized washing.

They are with us
Join us too!


2,000 installations in over 30 countries.
Our satisfied customers are proof that our hard work will give you the best experience. From the high level of competence of our engineers, through the consultative sales process, and ending with installation and after-sales service, everything has been designed to give you the greatest satisfaction.


 Portugal
 United Kingdom
 United States
 France
 Spain
Spain Germany
 Romania
 Italy
Italy Czech Republic
 Finland
 Hungary
 Slovakia
 Greece
 Lithuania
 South Korea
 Russia
 Saudi Arabia
 Poland
 Brasil
 Hebrew