Gestion / Articles
Causes et effets : qu’est-ce que le diagramme d’Ishikawa ?
Le diagramme d’Ishikawa permet de présenter des problèmes complexes d’une manière simple. Découvrez quel est le secret.

 9 minutes de lecture
2022-12-22 17:45:15
Le diagramme d’Ishikawa permet de présenter des problèmes complexes d’une manière simple. Découvrez quel est le secret.
Au départ, ce n’était qu’une arête de poisson. C’est cette structure incomparable qui a inspiré l’ingénieur japonais pour concevoir une manière simple de présenter des problèmes persistants – et leurs multiples causes, sous-causes, sous-sous-causes. C’est précisément cette complexité, que les analyses traditionnelles ne permettaient pas de résoudre, qui constitue la nécessité de priorisation et communication à l’origine de cette méthode pratique à l’objectif unique – atteindre les causes des problèmes. Découvrez en quoi consiste le diagramme d’Ishikawa et comment il peut aider à résoudre les problèmes au sein de votre entreprise.
Qu’est-ce que le diagramme d’Ishikawa ?
Le diagramme d’Ishikawa est un outil visuel d’amélioration permanente qui aide à identifier les causes d’un problème. Il est également connu sous le nom de diagramme en arêtes de poissons, en raison de la forme de son graphique.
La représentation s’effectue de droite à gauche, le problème (l’effet) étant placé à l’extrémité droite de l’arête de poisson. À partir de là, les autres arêtes sont ajoutées vers la gauche, à partir de l’arête centrale, représentée par une ligne horizontale.
Six autres lignes sont dessinées le long de cette arête, trois au-dessus et trois en-dessous. Ces lignes représentent les grands types de causes possibles, afin de n’oublier aucun facteur :
- Machines. Cette catégorie considère les causes possibles associées au dysfonctionnement des outils et des équipements utilisés pendant le processus. Quelques exemples peuvent être des programmes obsolètes, des serveurs au fonctionnement défaillant ou des appareils à faible rendement.
- Matières. Inclut les problèmes relatifs aux matières premières. Par exemple, la matière peut ne pas être conforme aux exigences du travail ou présenter des caractéristiques incompatibles avec le processus.
- Milieu. Cette catégorie inclut les facteurs environnementaux pouvant favoriser le problème, par exemple, des températures élevées, un manque d’espace, un layout peu optimisé ou du bruit.
- Main d’œuvre. Les problèmes peuvent survenir en raison d’une mauvaise attribution des tâches ou de difficultés rencontrées par les salariés dans l’exécution de leur travail. Quelques exemples peuvent inclure un manque de formation ou de contrôle.
- Méthode. Les méthodes de travail utilisées pendant les processus peuvent contribuer au problème. Il est donc important de considérer s’il existe des processus de production, des documents et si ceux-ci sont les plus adéquats et s’ils sont à jour.
- Mesure. Cette catégorie couvre les mesures utilisées pour évaluer le travail. On peut y trouver des facteurs tels que la fiabilité des instruments de calibrage ou des paramètres de production inadaptés.
En dépit de l’existence de ces catégories, le diagramme d’Ishikawa se doit d’être flexible, afin de s’adapter à la réalité de chaque entreprise. Il peut s’avérer nécessaire d’ajouter plus d’ « arêtes » ou même en enlever, selon les besoins. Dans chacune de ces six catégories, également connues comme les 6M, les causes racines les plus importantes sont identifiées. Pour ce faire, l’équipe affrontant le problème au quotidien doit se demander « pourquoi est-ce que ce problème se produit » et le faire régulièrement jusqu’à identifier la cause principale. Il suffira ensuite de le classer dans « l’arête » du diagramme la plus adéquate.
À la fin, pour un certain problème, il devra être possible d’établir le Top 10 des causes les plus critiques – celles résolues feront en sorte que le problème cesse ou le réduiront considérablement.
Quels sont les avantages du diagramme d’Ishikawa ?
En résumé, le diagramme d’Ishikawa permet d’identifier, d’organiser et de partager les causes d’un certain problème, classées par catégories, qui facilitent leur analyse et leur résolution. Le principal avantage réside dans la simplification de l’analyse des causes d’un problème, par le biais d’un graphique immédiat et intuitif. Il est donc plus simple de découvrir la cause principale du problème, en garantissant en même temps qu’aucune catégorie n’est oubliée. Plus le « poisson a d’arêtes », plus profonde et complète sera la compréhension du problème – sans toutefois exagérer pour ne pas se perdre dans la lecture.
Le diagramme d’Ishikawa peut être utilisé pour analyse des problèmes au niveau des processus, des secteurs de travail ou même une entreprise dans son ensemble, d’une manière plus étendue et orientée. Le fait d’aller au-delà des symptômes et de chercher les causes facilite la découverte d’une solution qui soit objectivement efficace. C’est également un excellent outil à utiliser en équipe, en sessions de brainstorming, où tout le monde peut participer. En outre, même une fois un problème résolu, le diagramme d’Ishikawa met souvent en avant d’autres faiblesses qui n’avaient pas été observées auparavant, permettant ainsi de les corriger avant de causer des problèmes à plus long terme.
Comment utiliser le diagramme d’Ishikawa dans la pratique
Bien que très simple en apparence, pour que l’utilisation du diagramme d’Ishikawa soit efficace, il est nécessaire de suivre certaines règles, notamment lorsqu’il est établi en équipe – ainsi qu’il est recommandé. Pour cela, les étapes suivantes doivent être mises en place :
- Définir clairement le problème à analyser (de préférence, avec des données)
- Dessiner une flèche horizontale pointée vers la droite et ajouter un carré à l’extrémité.
- Écrire le problème dans ce carré.
- Tracer des diagonales à partir du corps de la flèche, destinées à contenir les catégories des causes selon les 6M (Machines, Matières, Milieu, Main d’œuvre, Méthode et Mesures).
- Réunir l’équipe et organiser un brainstorming afin d’identifier les causes possibles.
- Ajouter les causes identifiées au diagramme, en les énumérant en fonction de leur gravité ou leur importance.
Par exemple, imaginons l’application du diagramme d’Ishikawa à un problème de manque de capacité au niveau du processus de lavage, défini par un rendement inférieur à celui espéré de « x » plateaux par jour. Si l’on suit la méthode, la première étape consiste à créer le diagramme et les 6M. Parmi les problèmes rencontrés avec des Machines, on pourrait enregistrer une durée de cycle élevée. Dans les Méthodes, peut-être que le processus de chargement et déchargement est trop long et manuel. Dans la Main d’œuvre, on pourrait inclure les difficultés à opérer la machine – et comme sous-causes, le manque de formation des collaborateurs. Et ainsi de suite jusqu’à remplir tout le tableau. Une fois tous les facteurs énumérés, il sera possible d’identifier les causes réelles qui contribuent au problème et, par conséquent, mettre en place les actions correctives pertinentes.
Somengil, l’amélioration permanente du lavage industriel
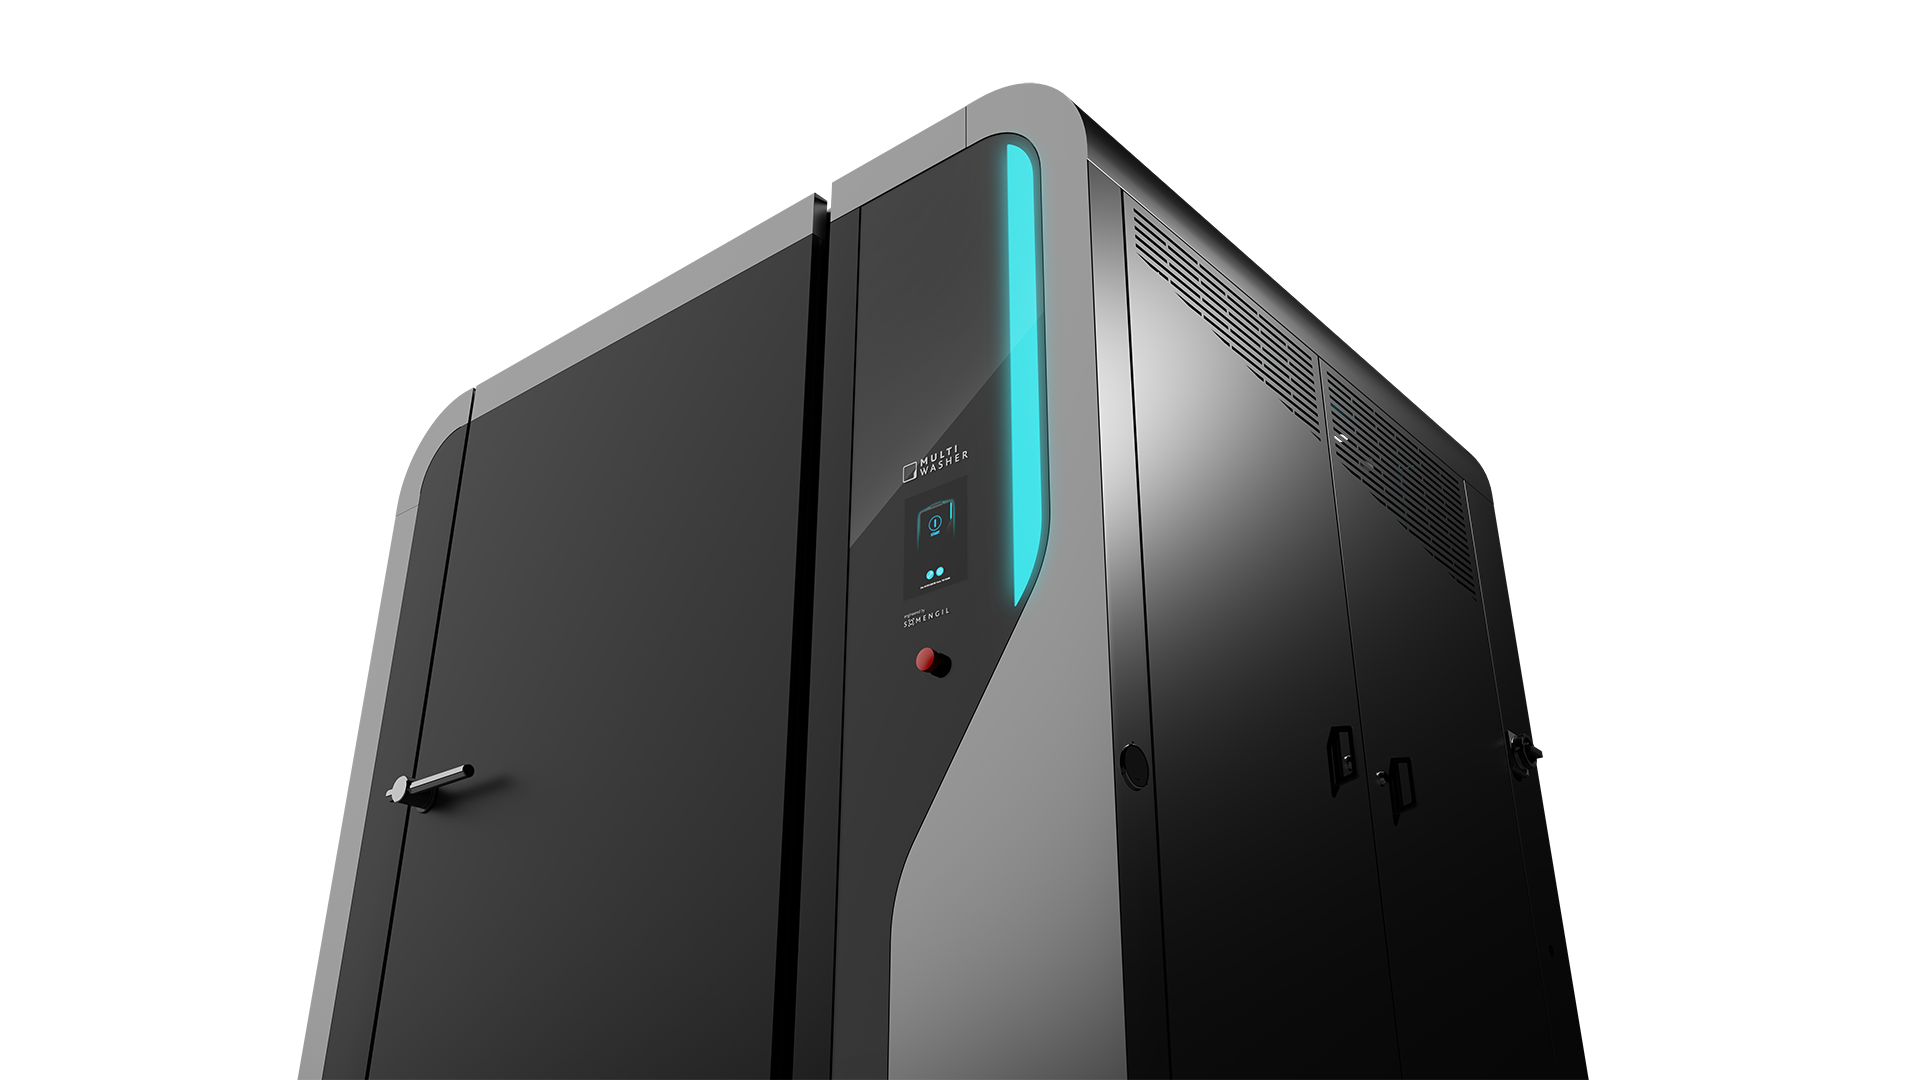
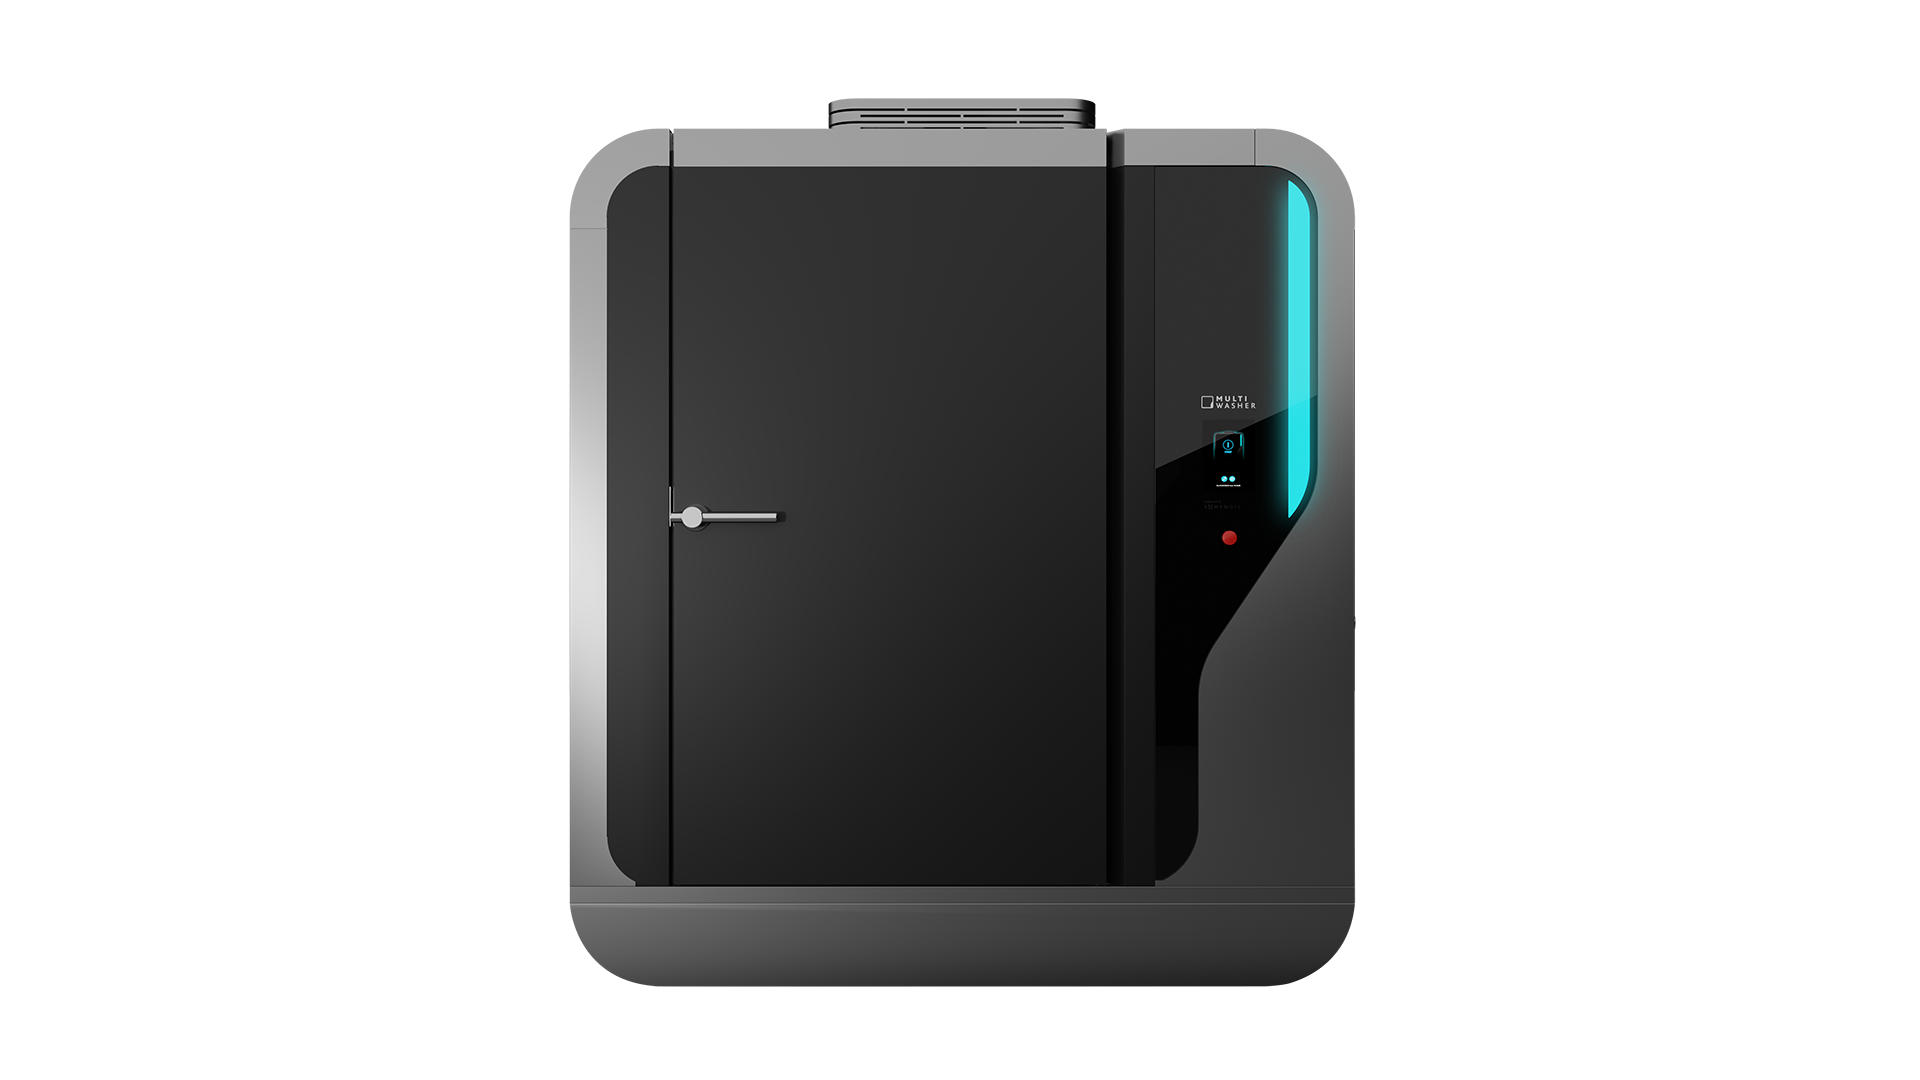
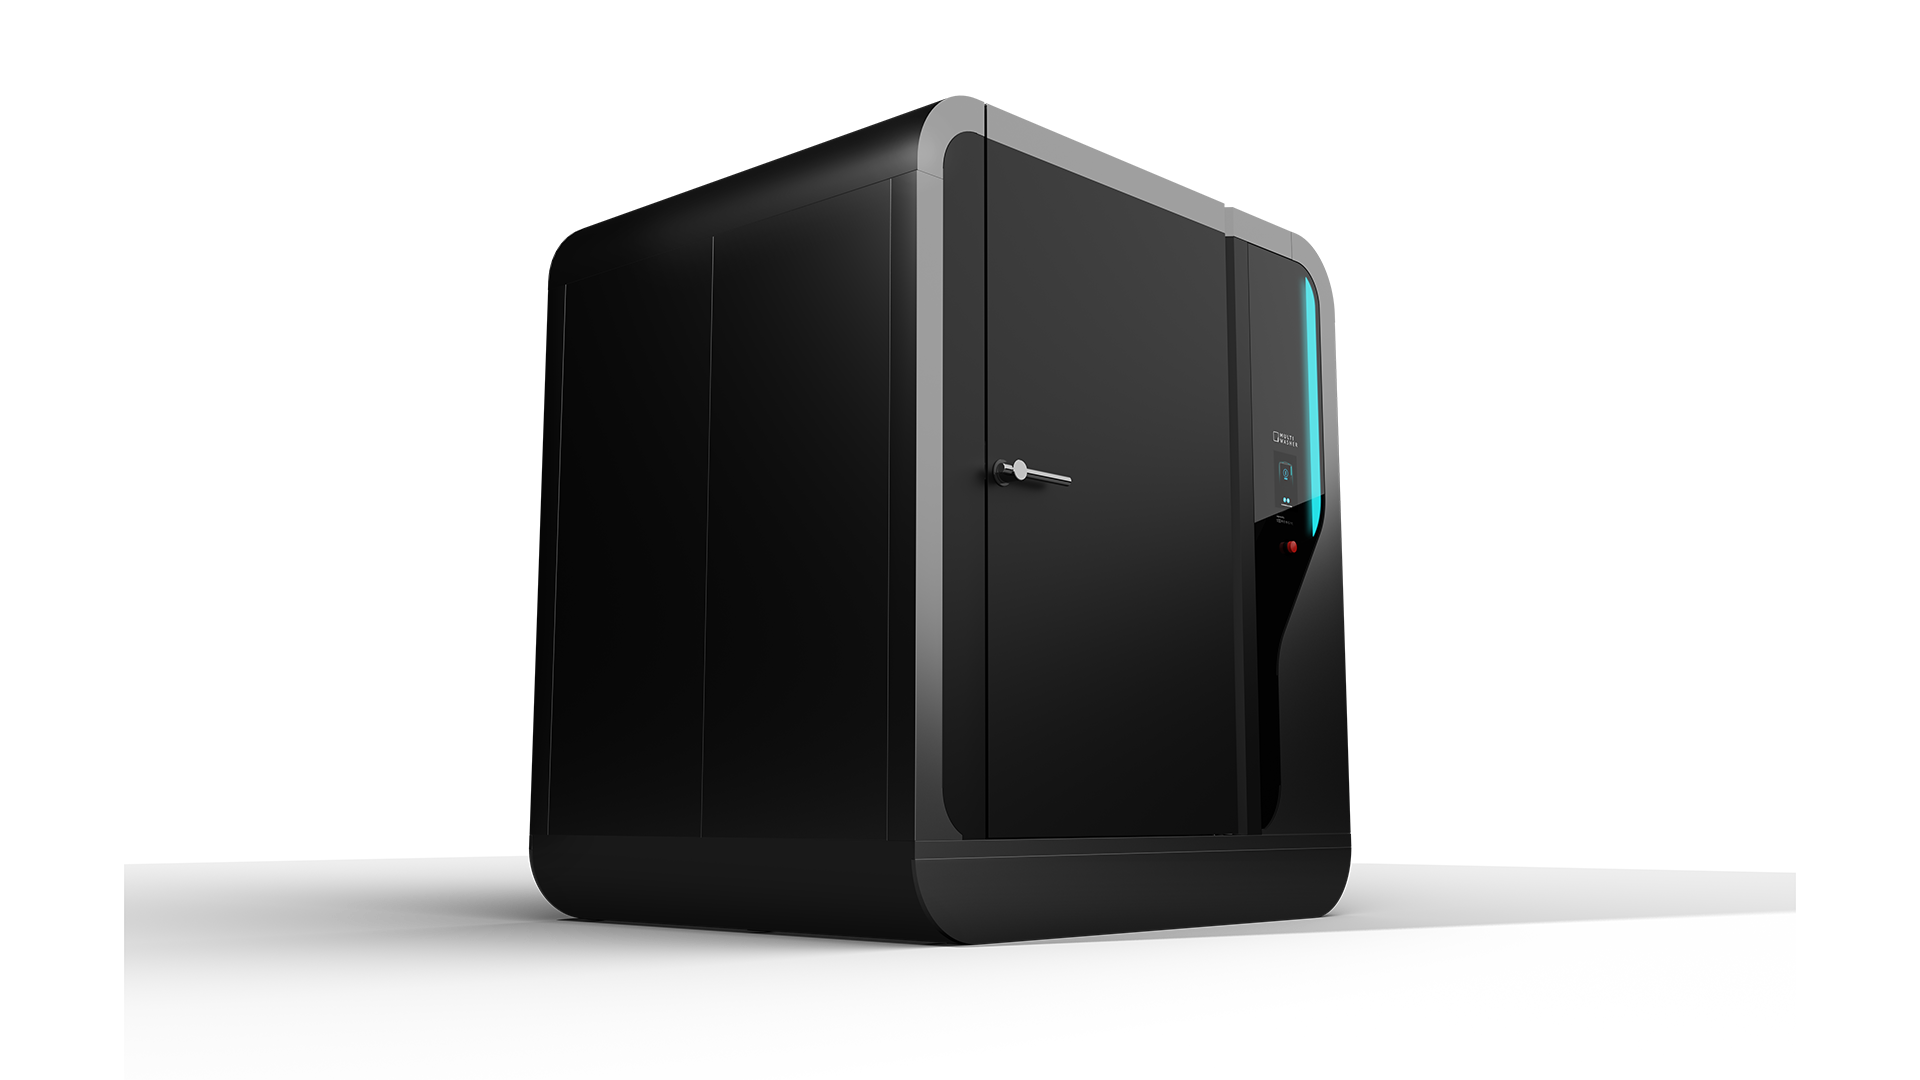
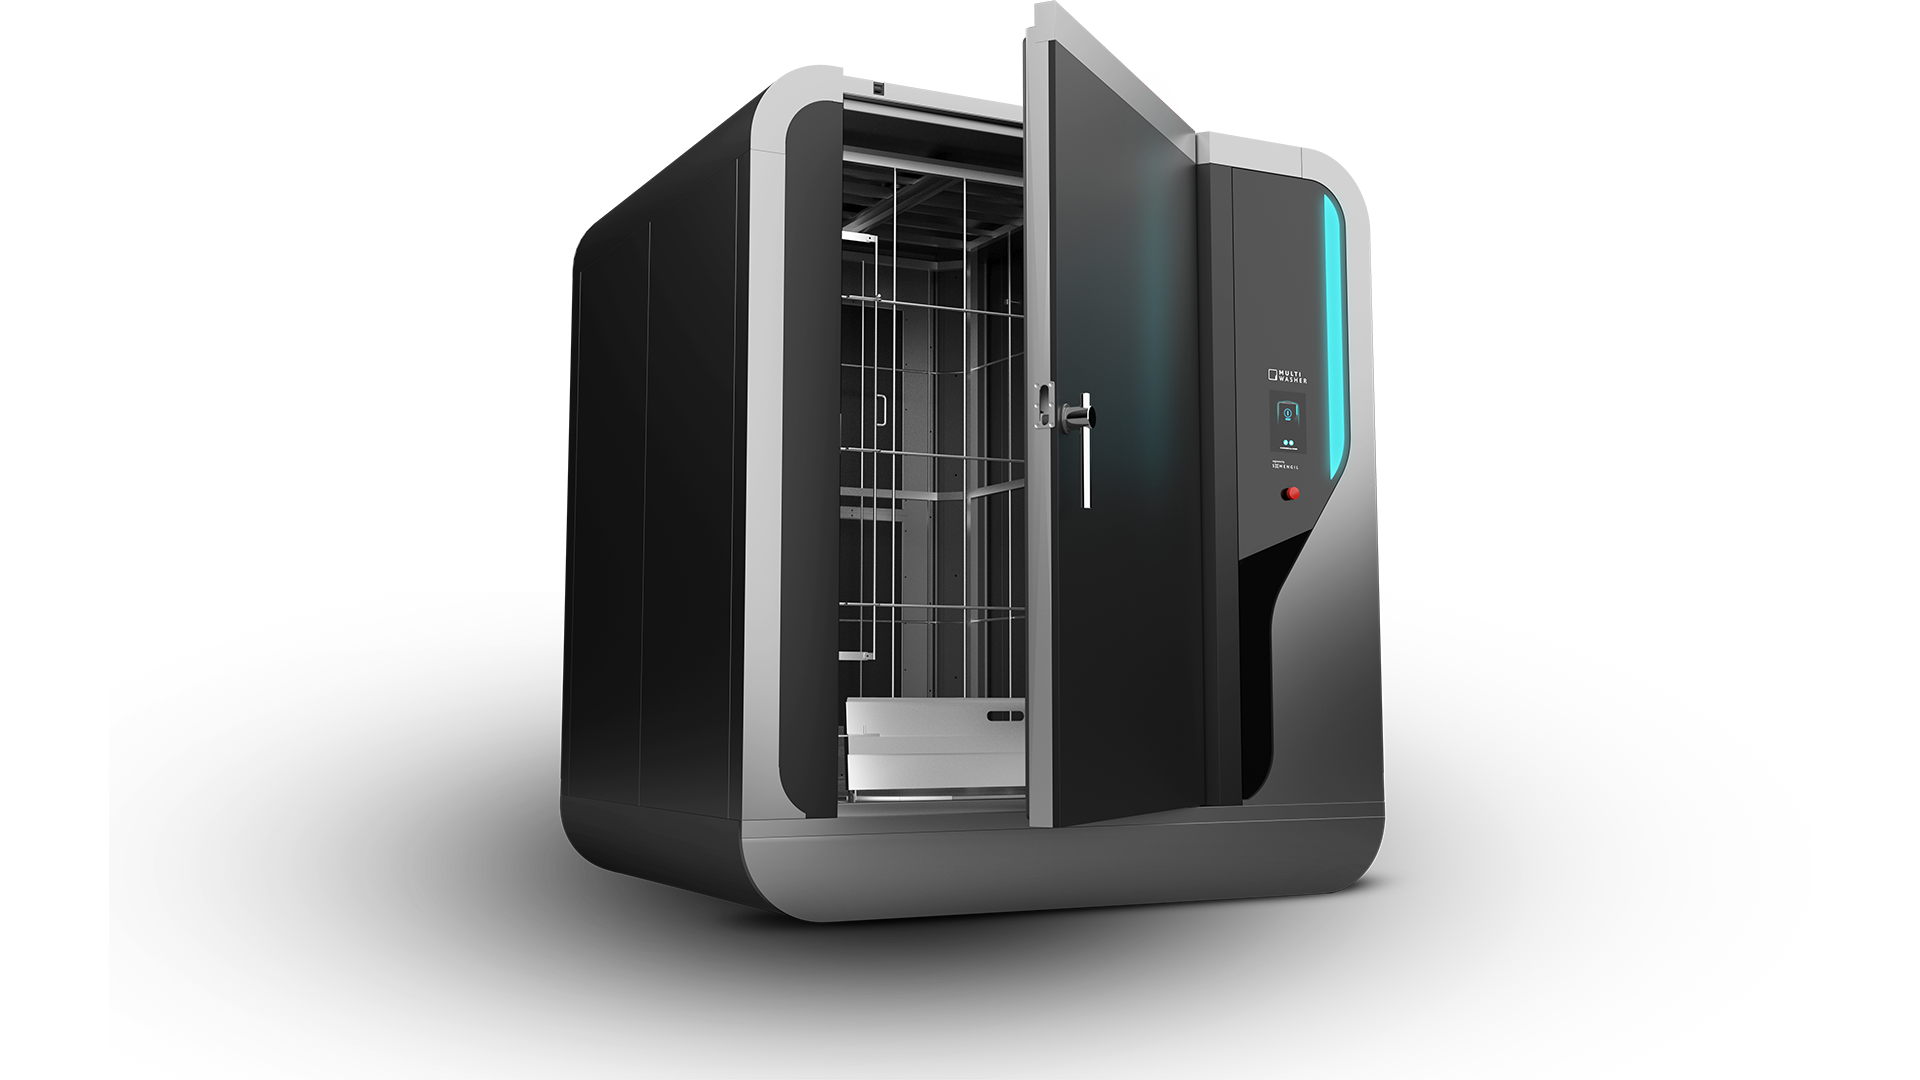
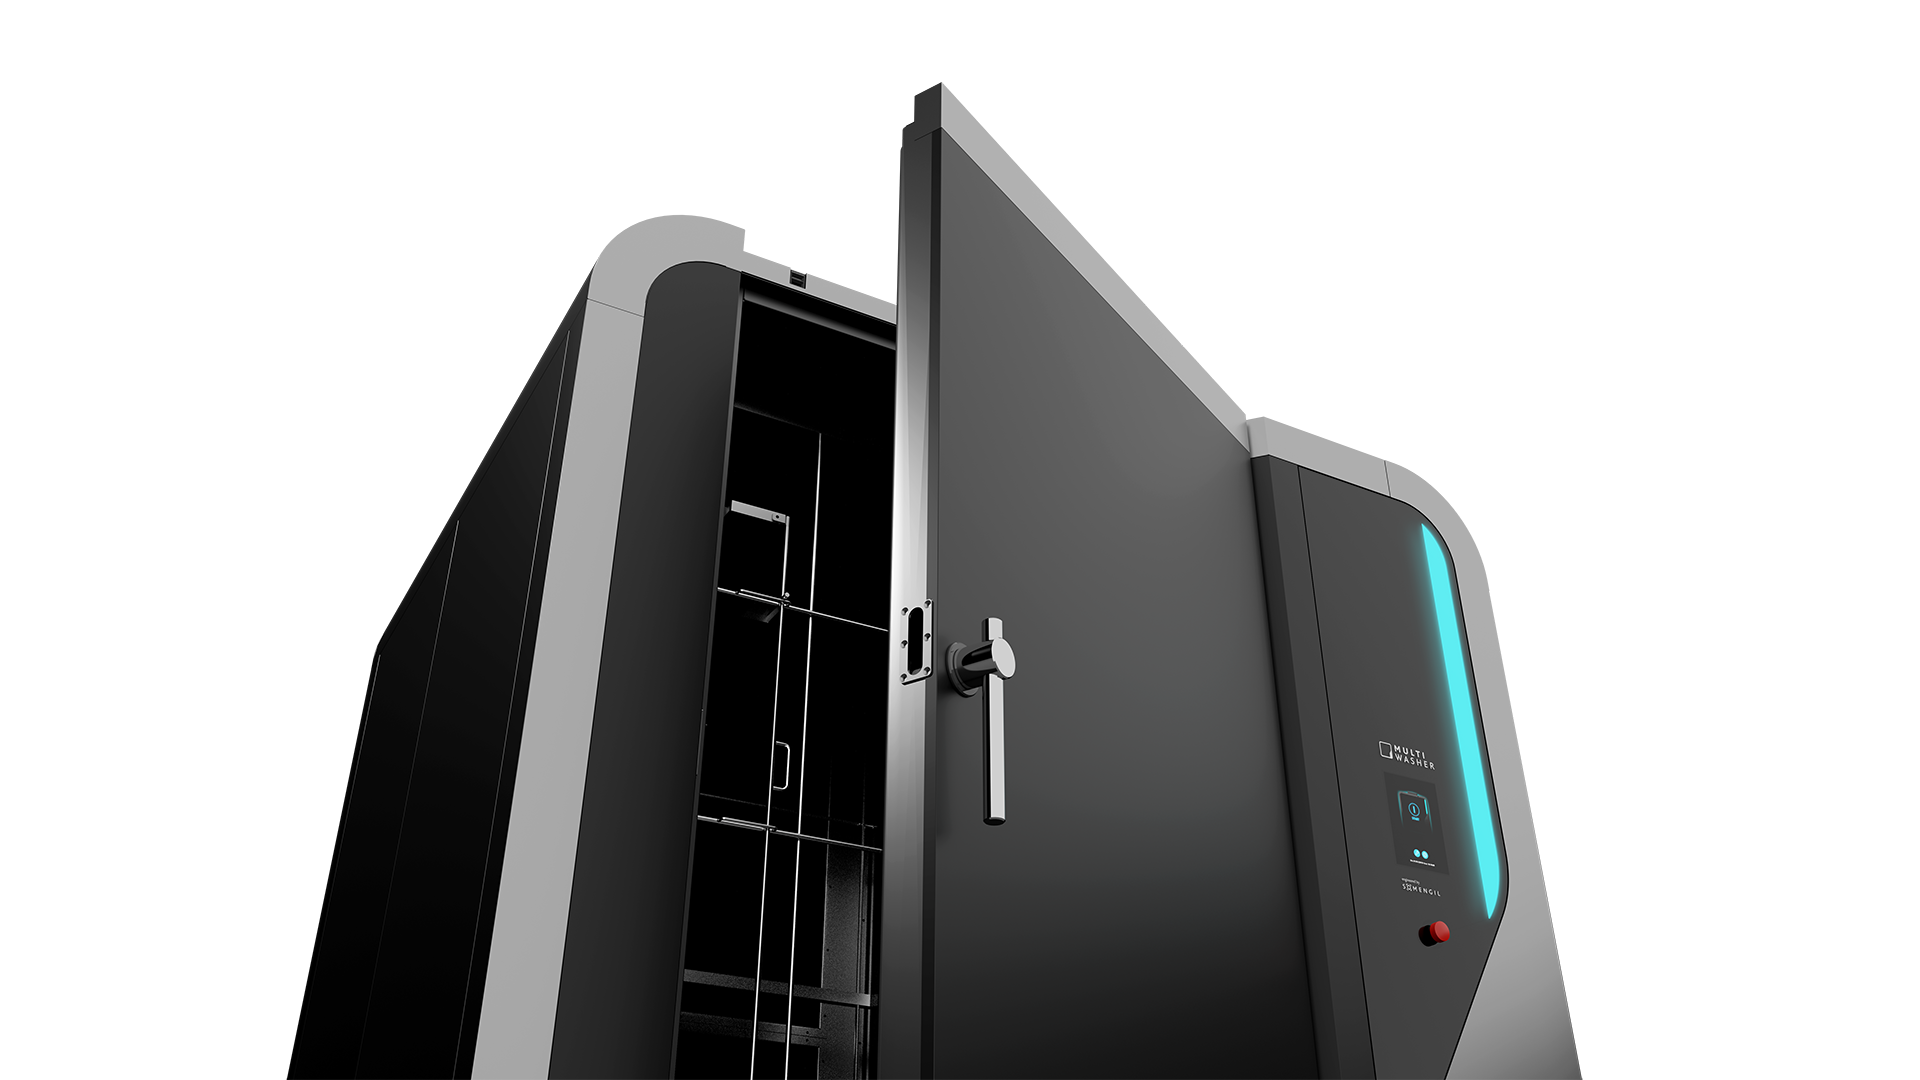
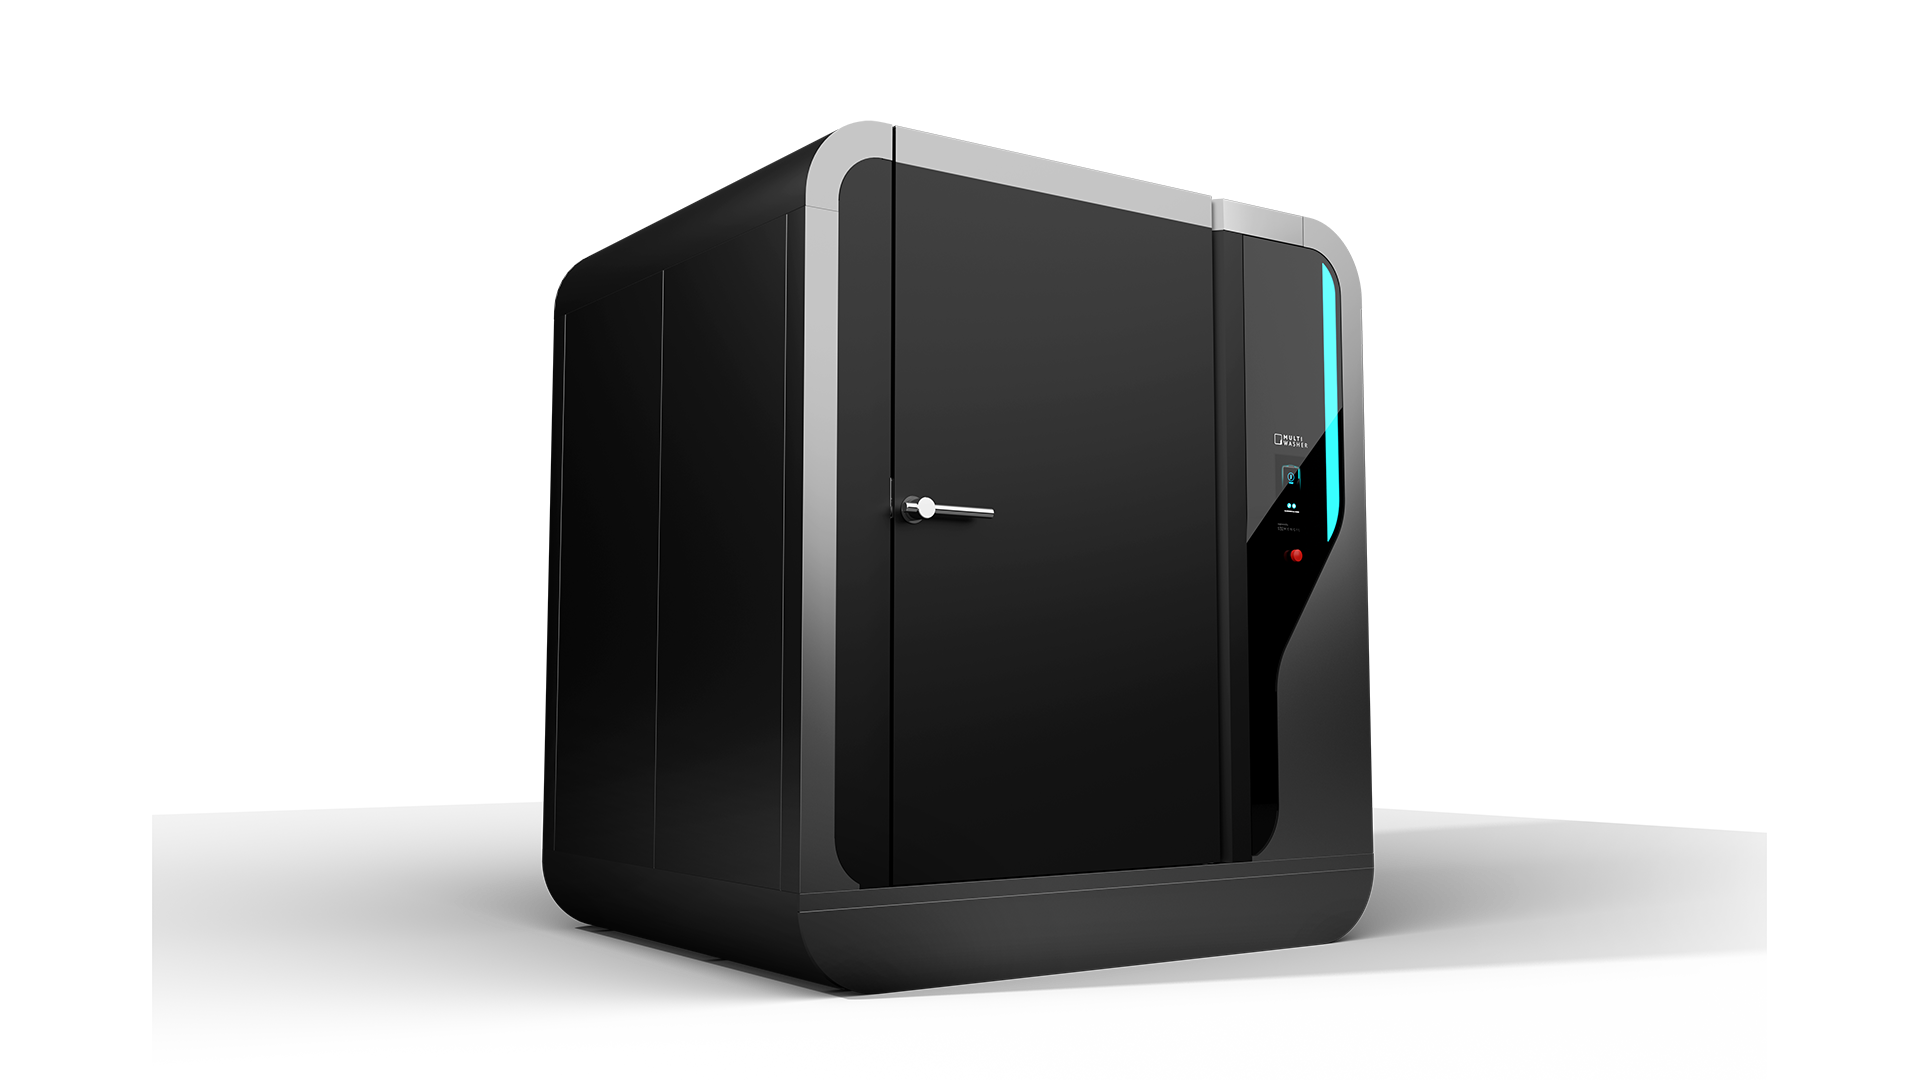
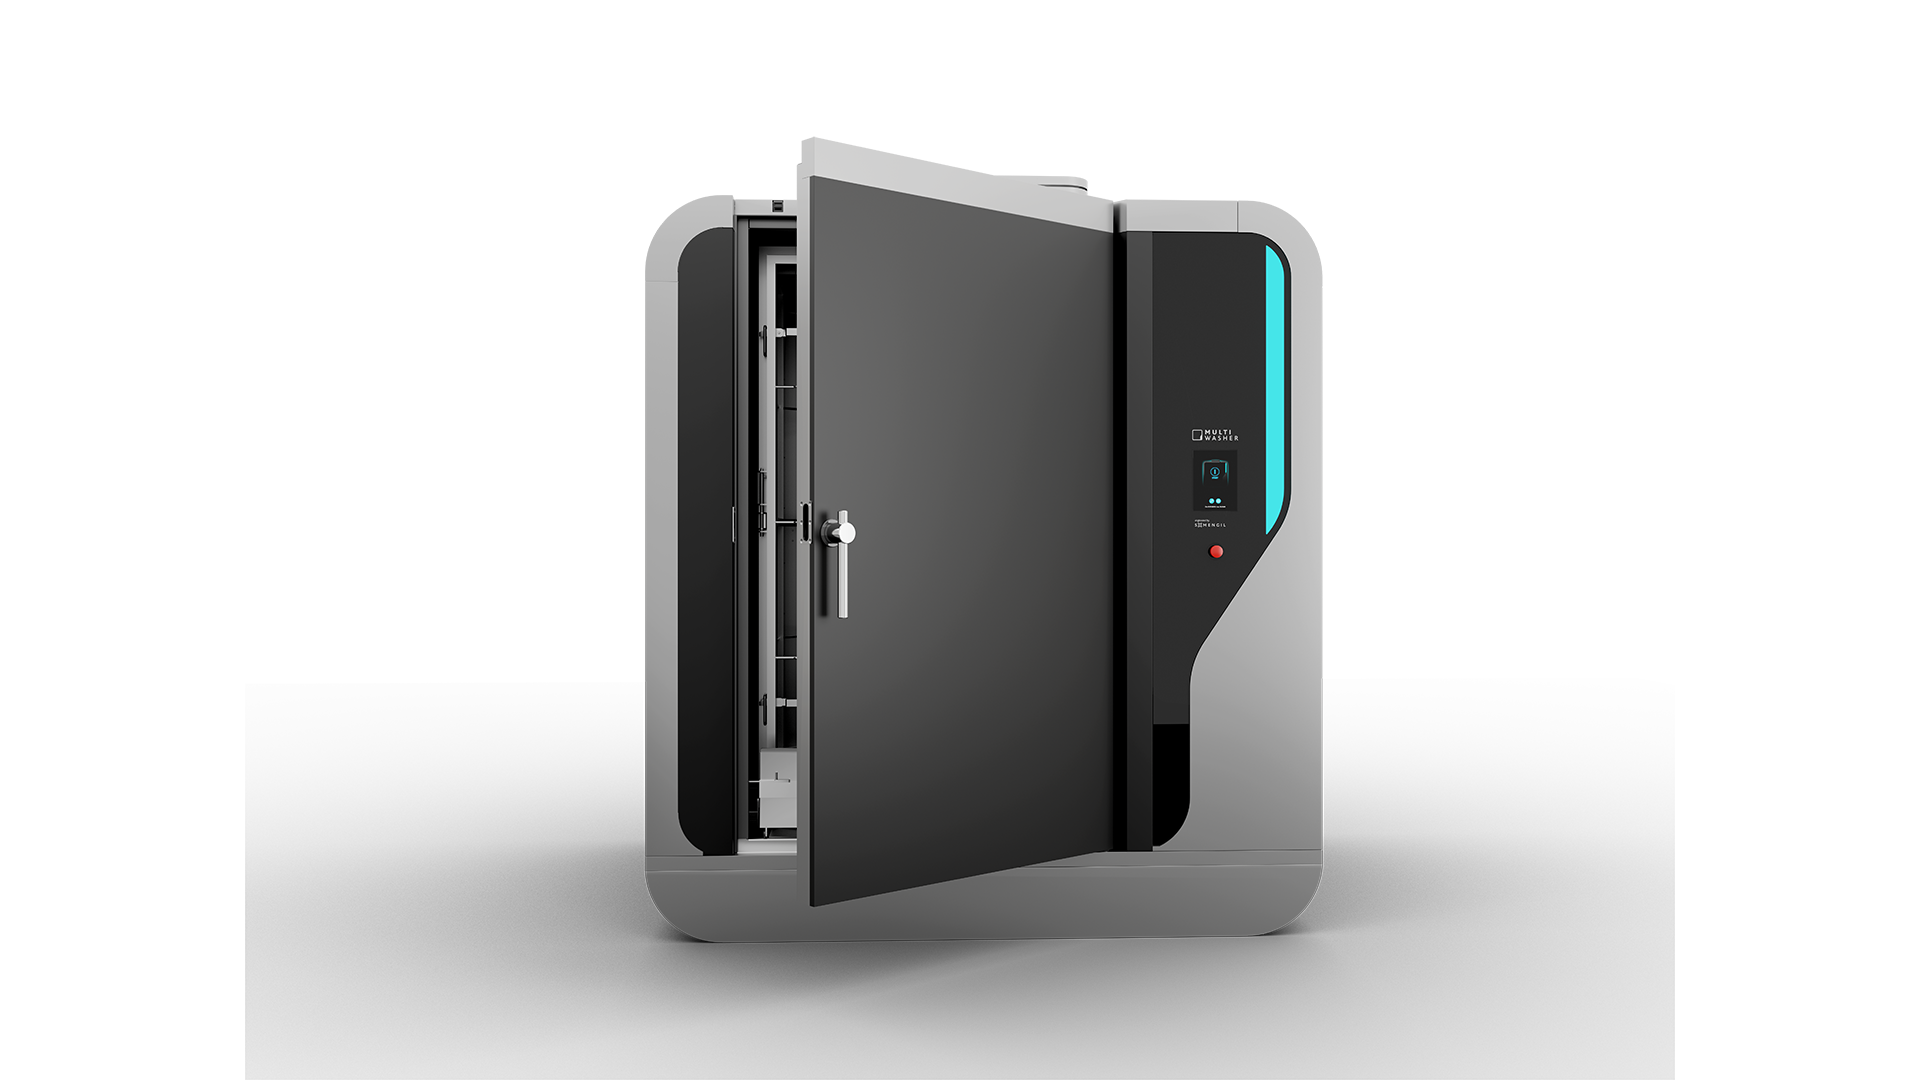
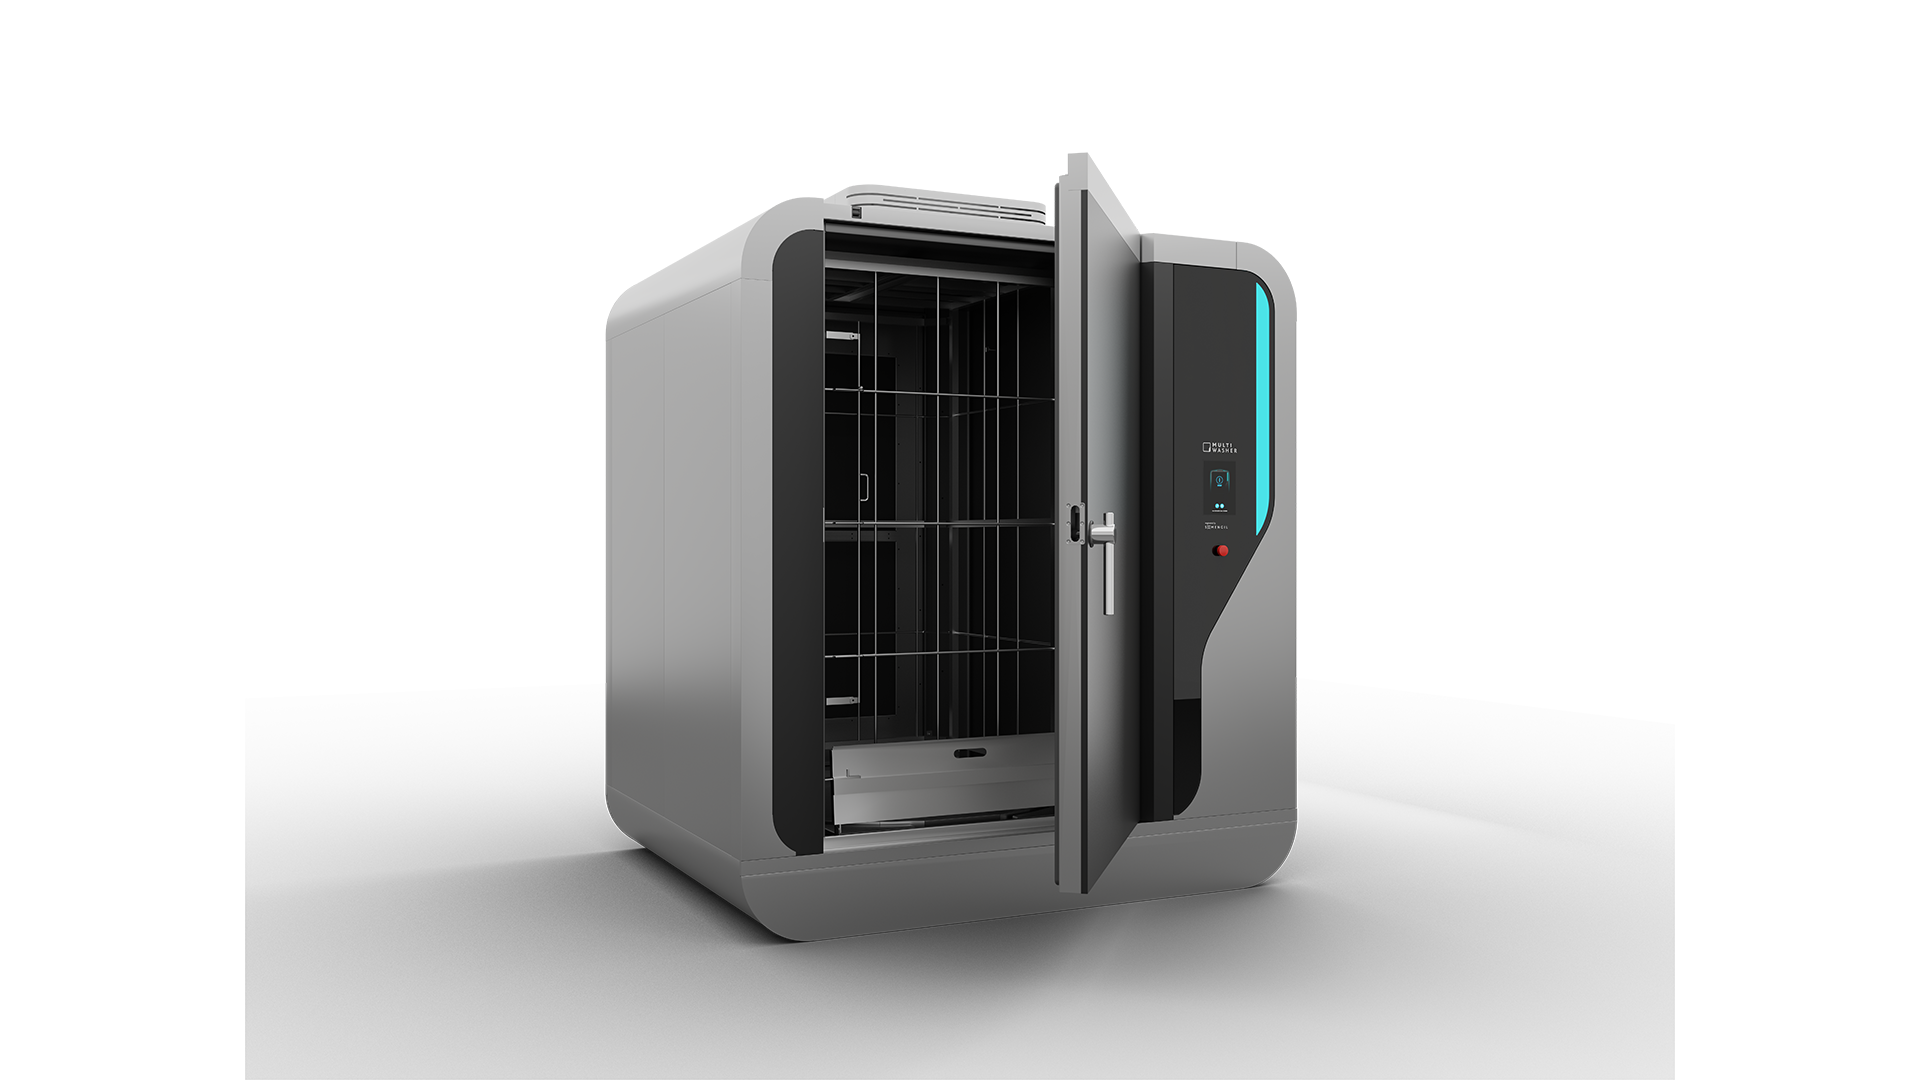
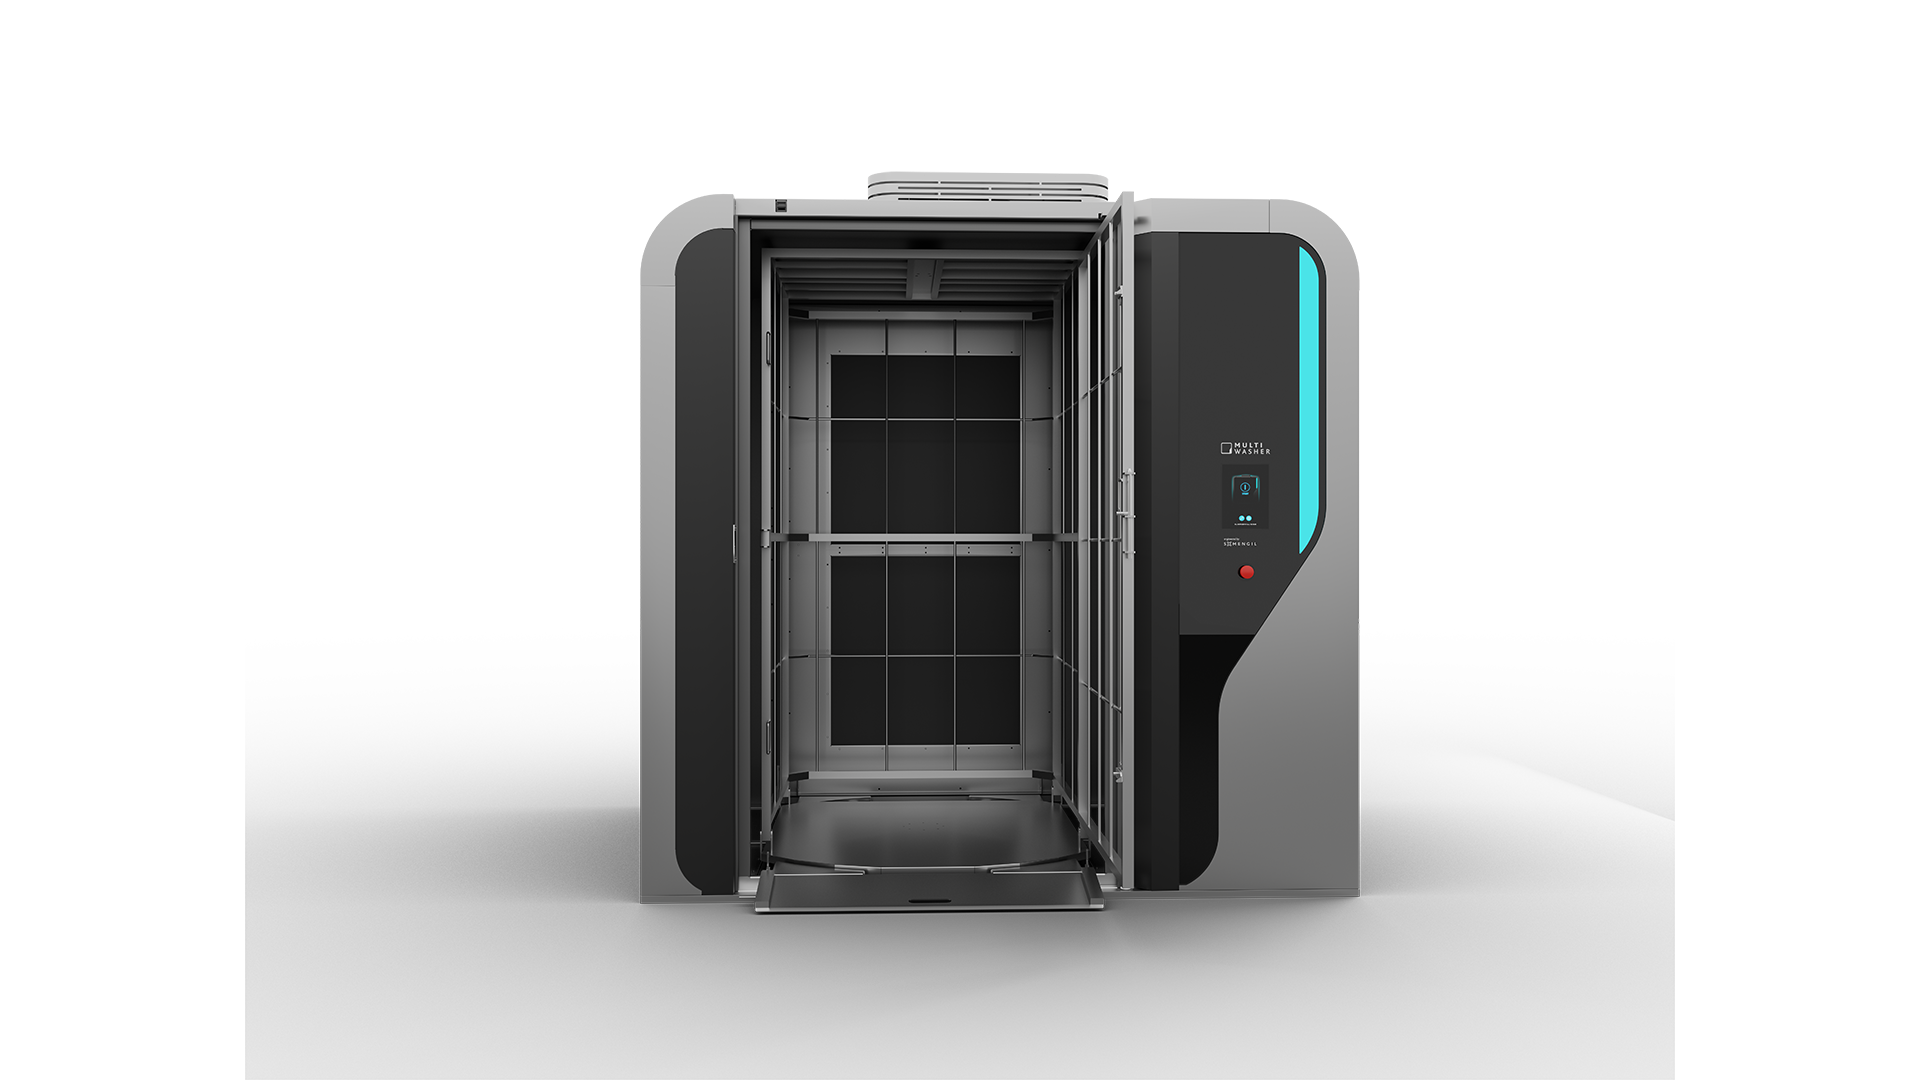
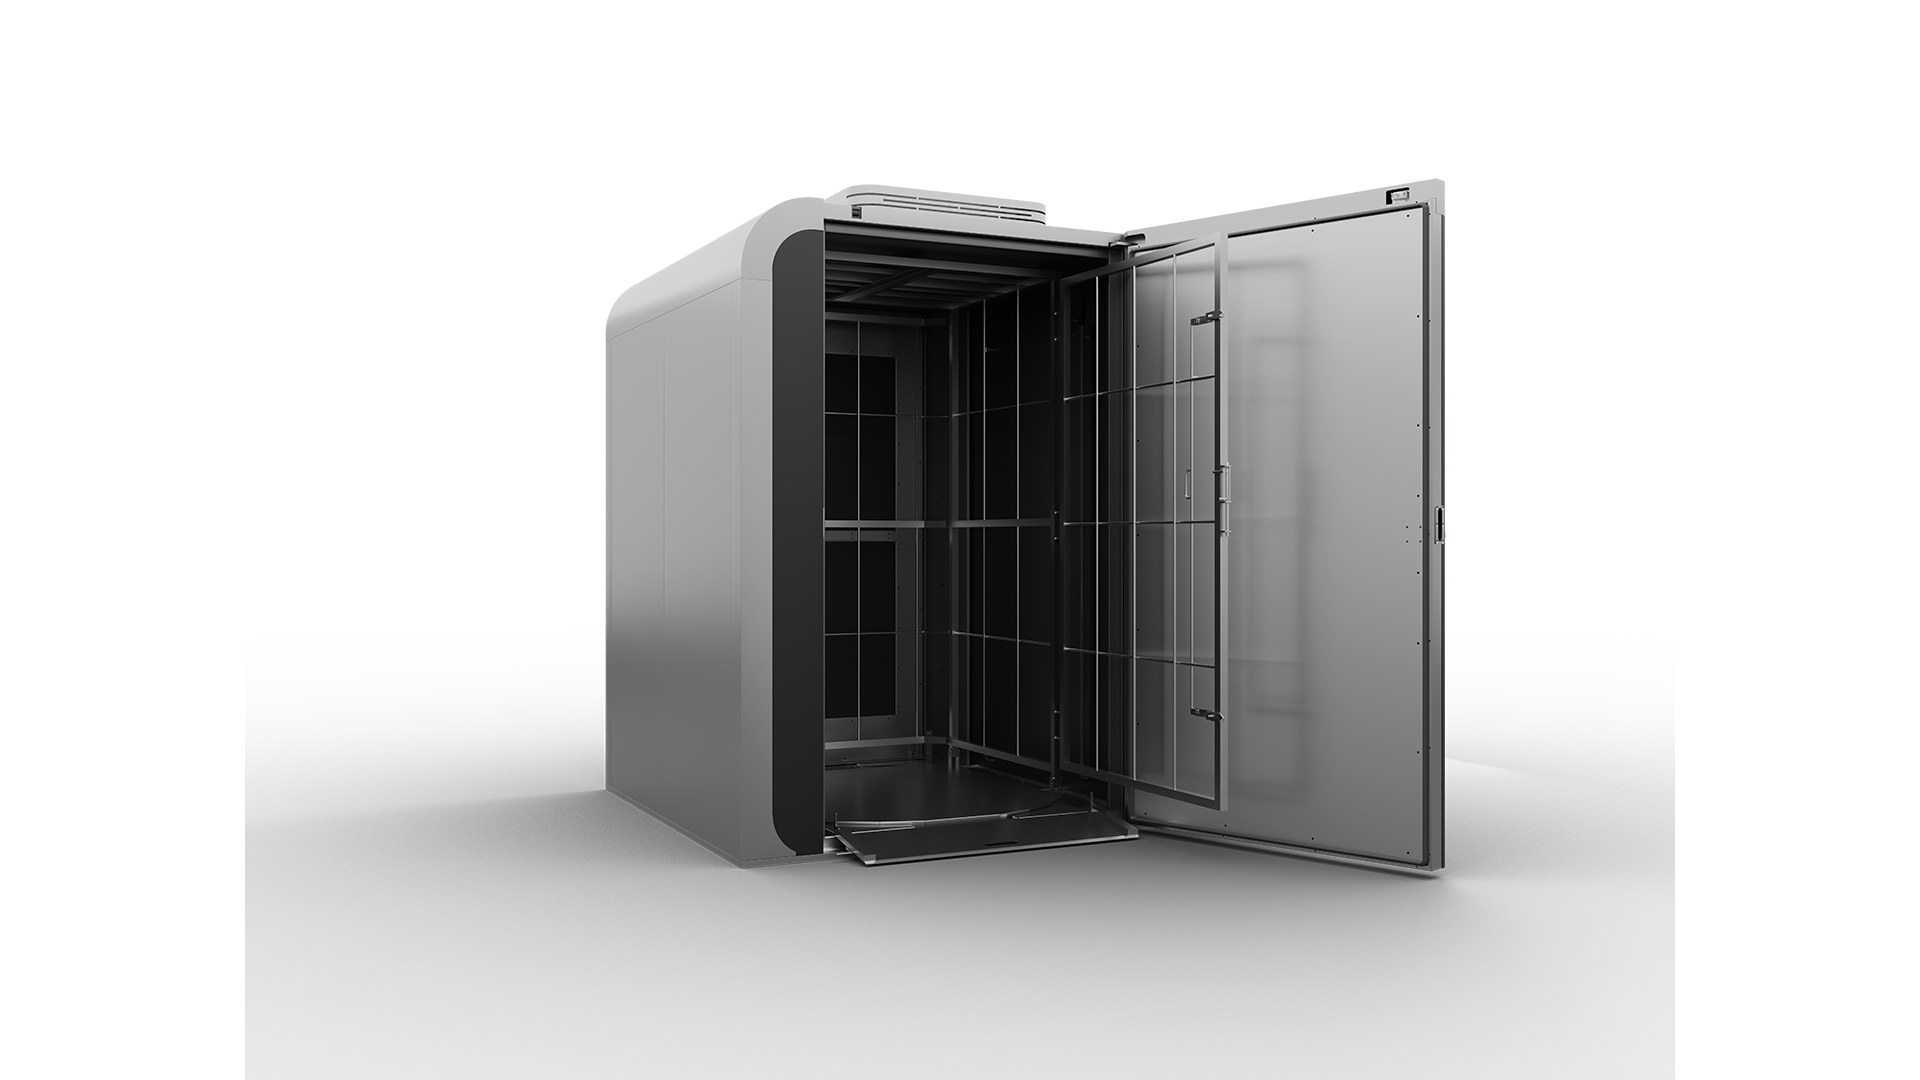
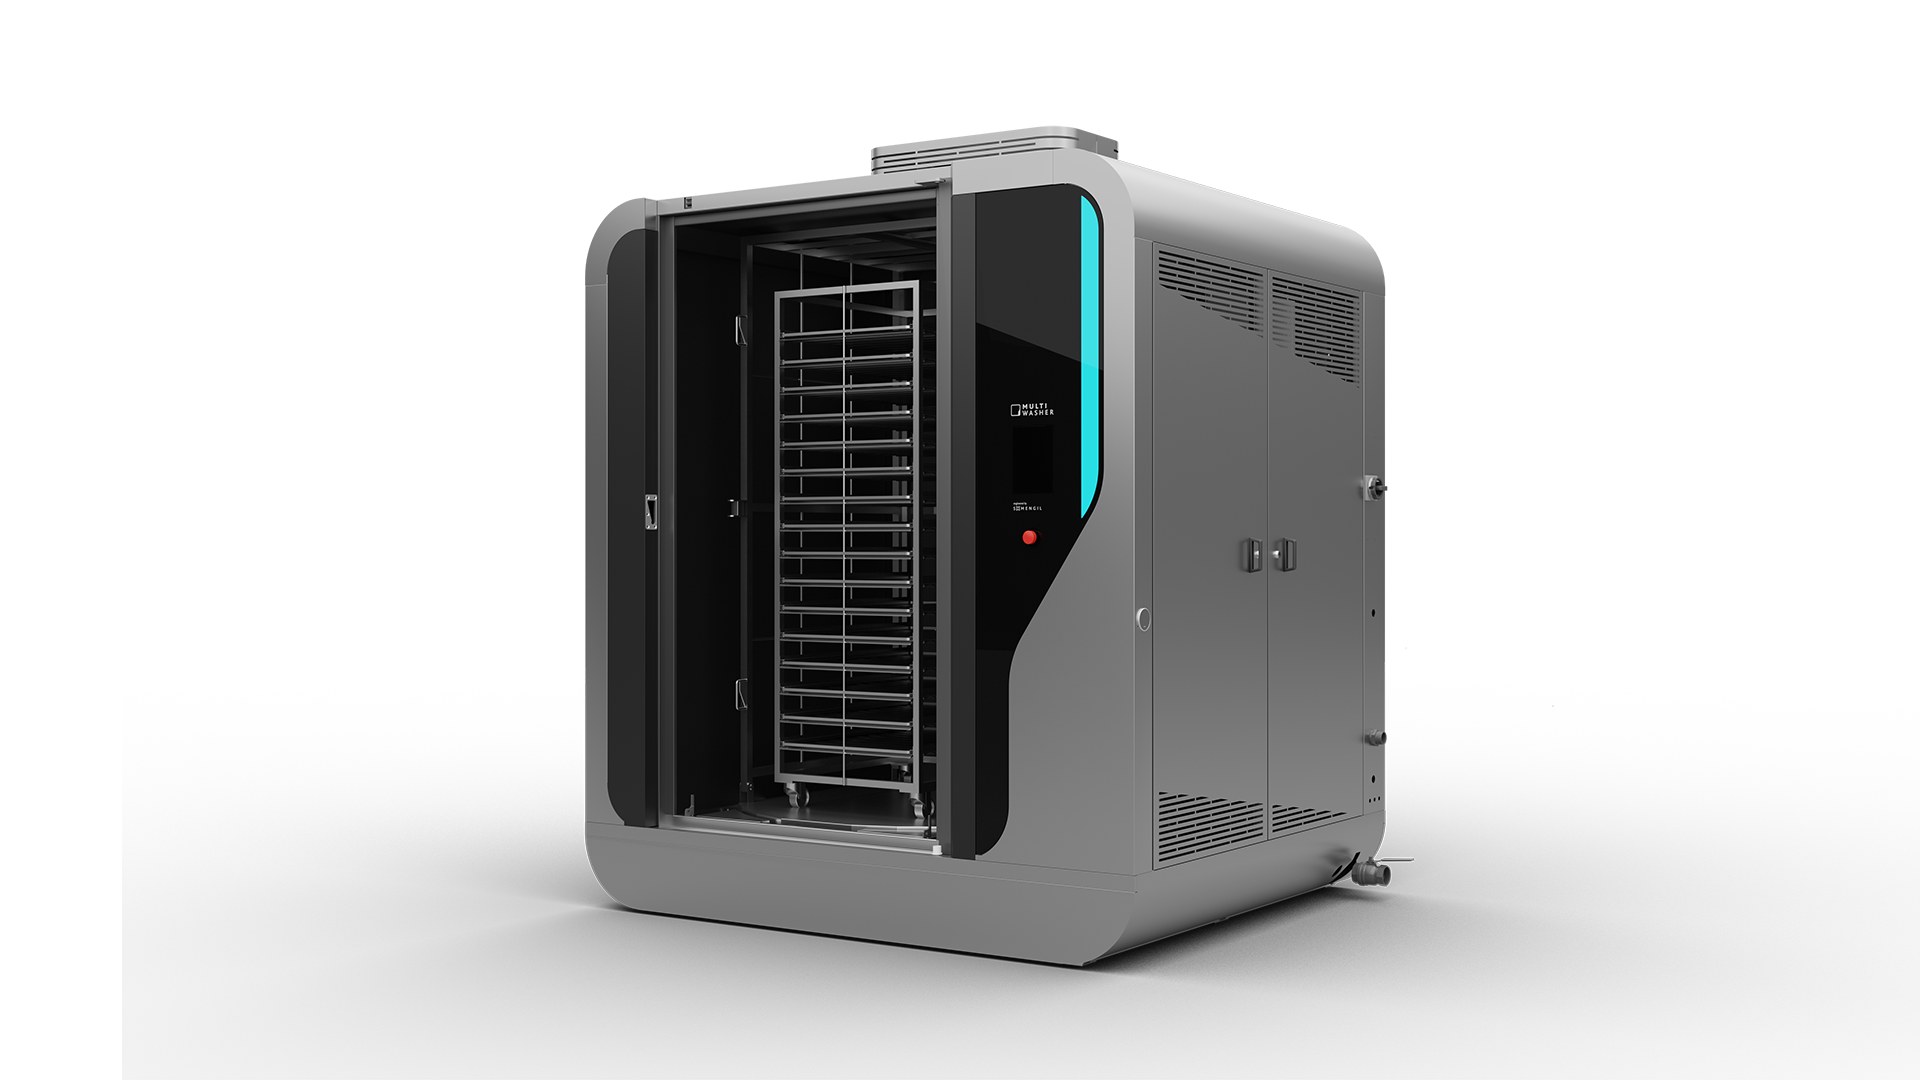
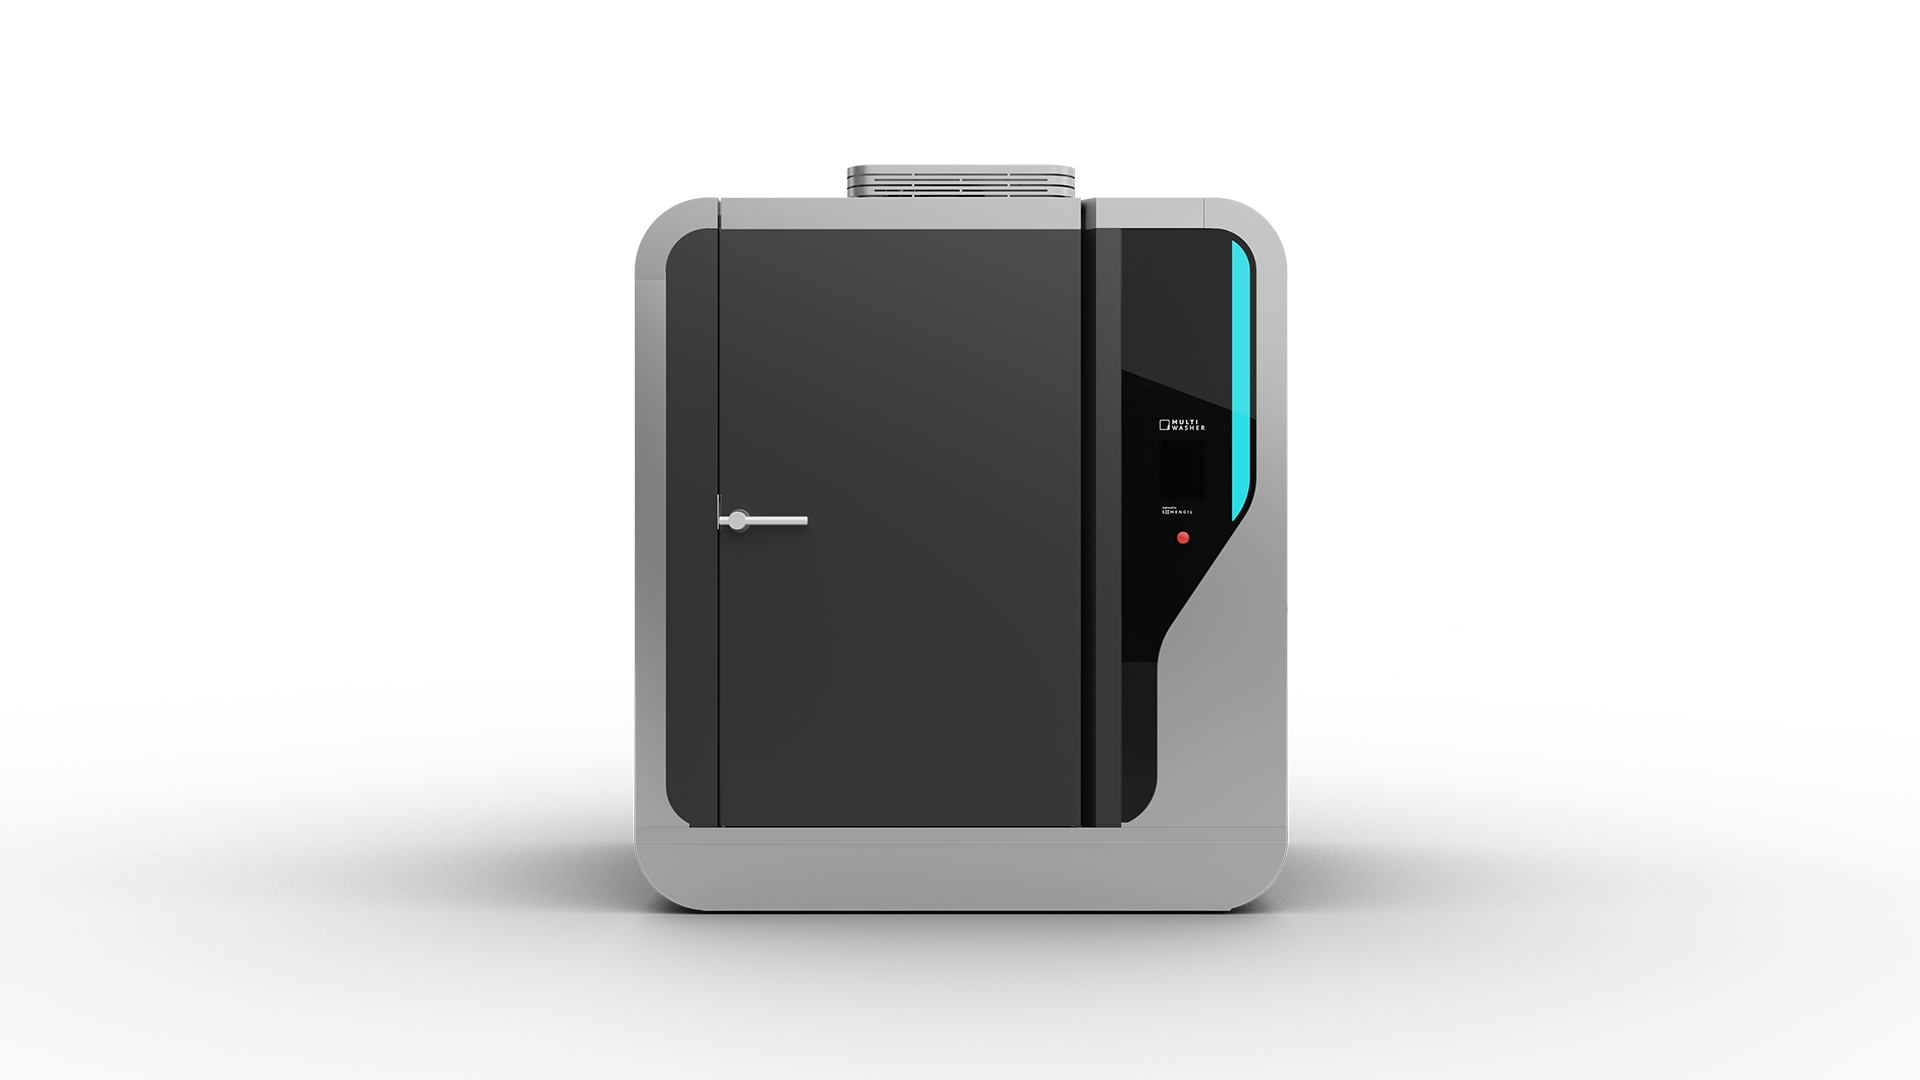
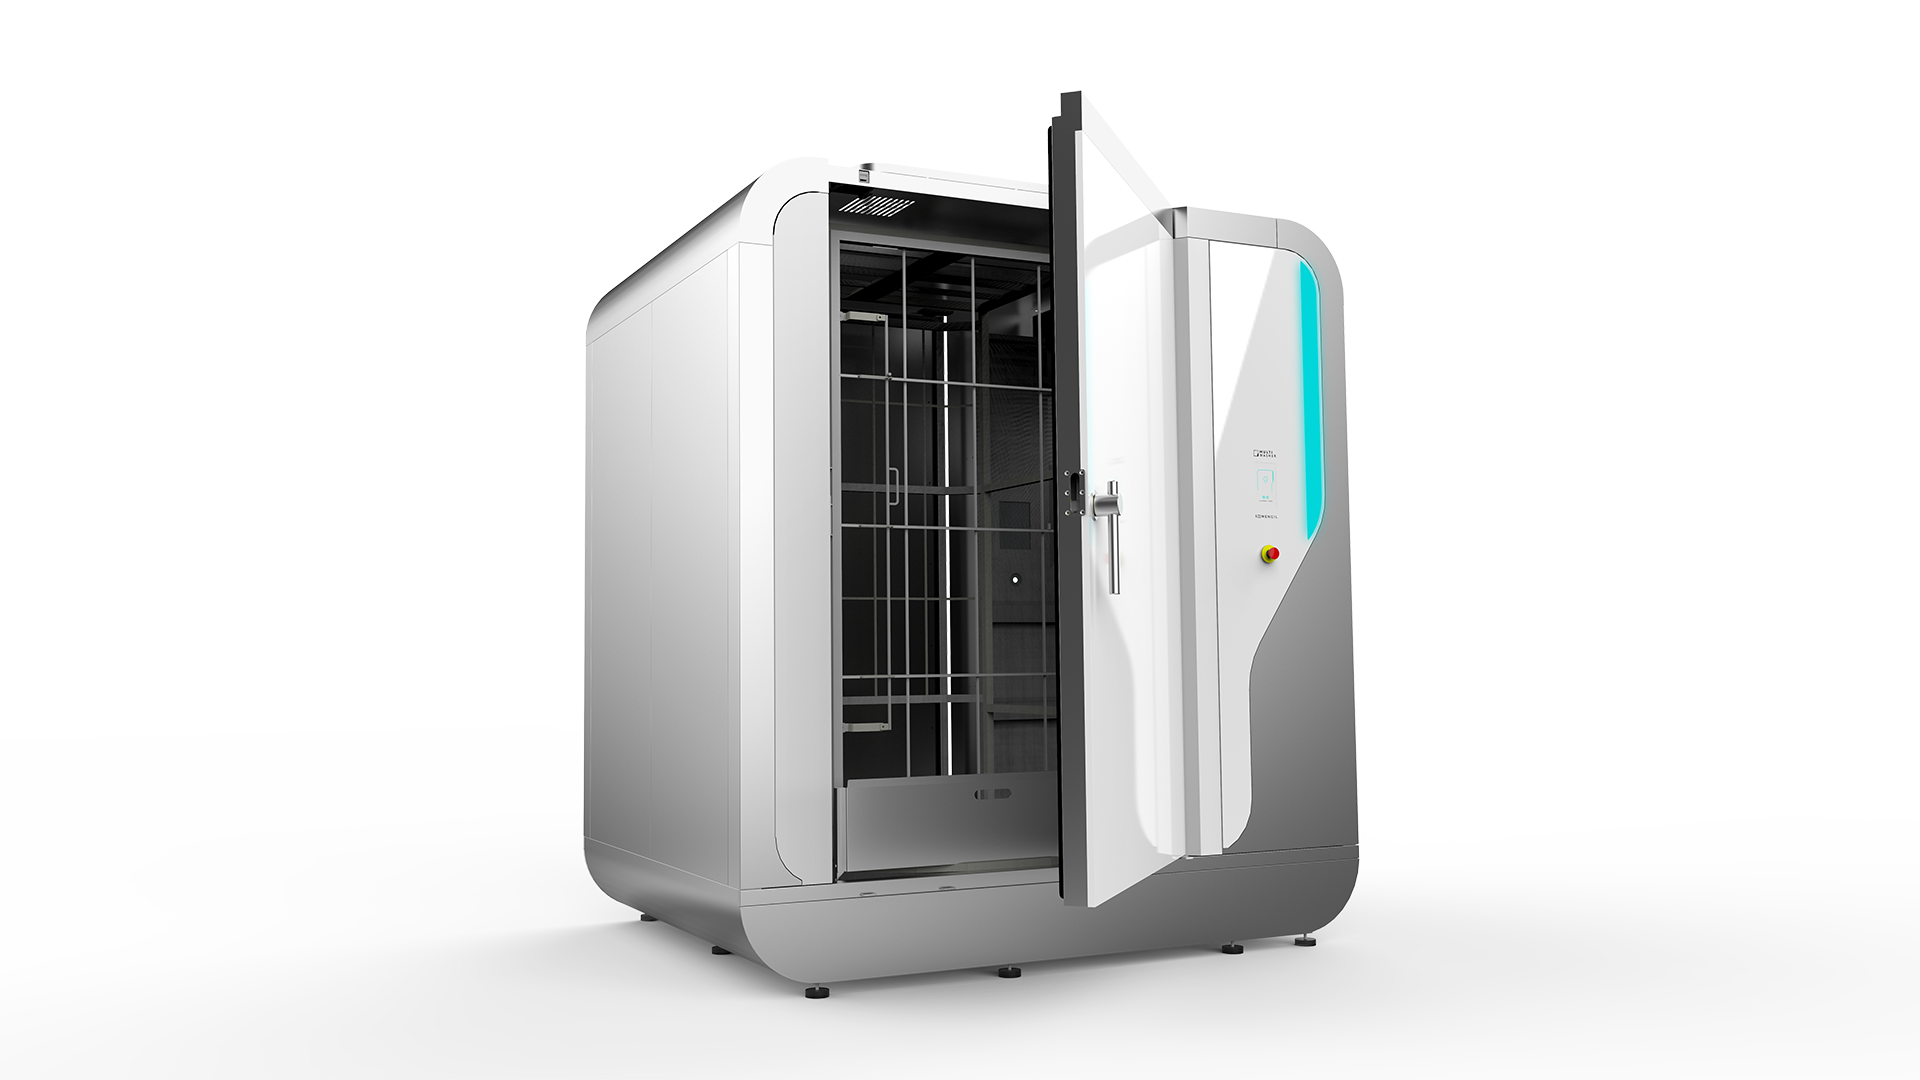
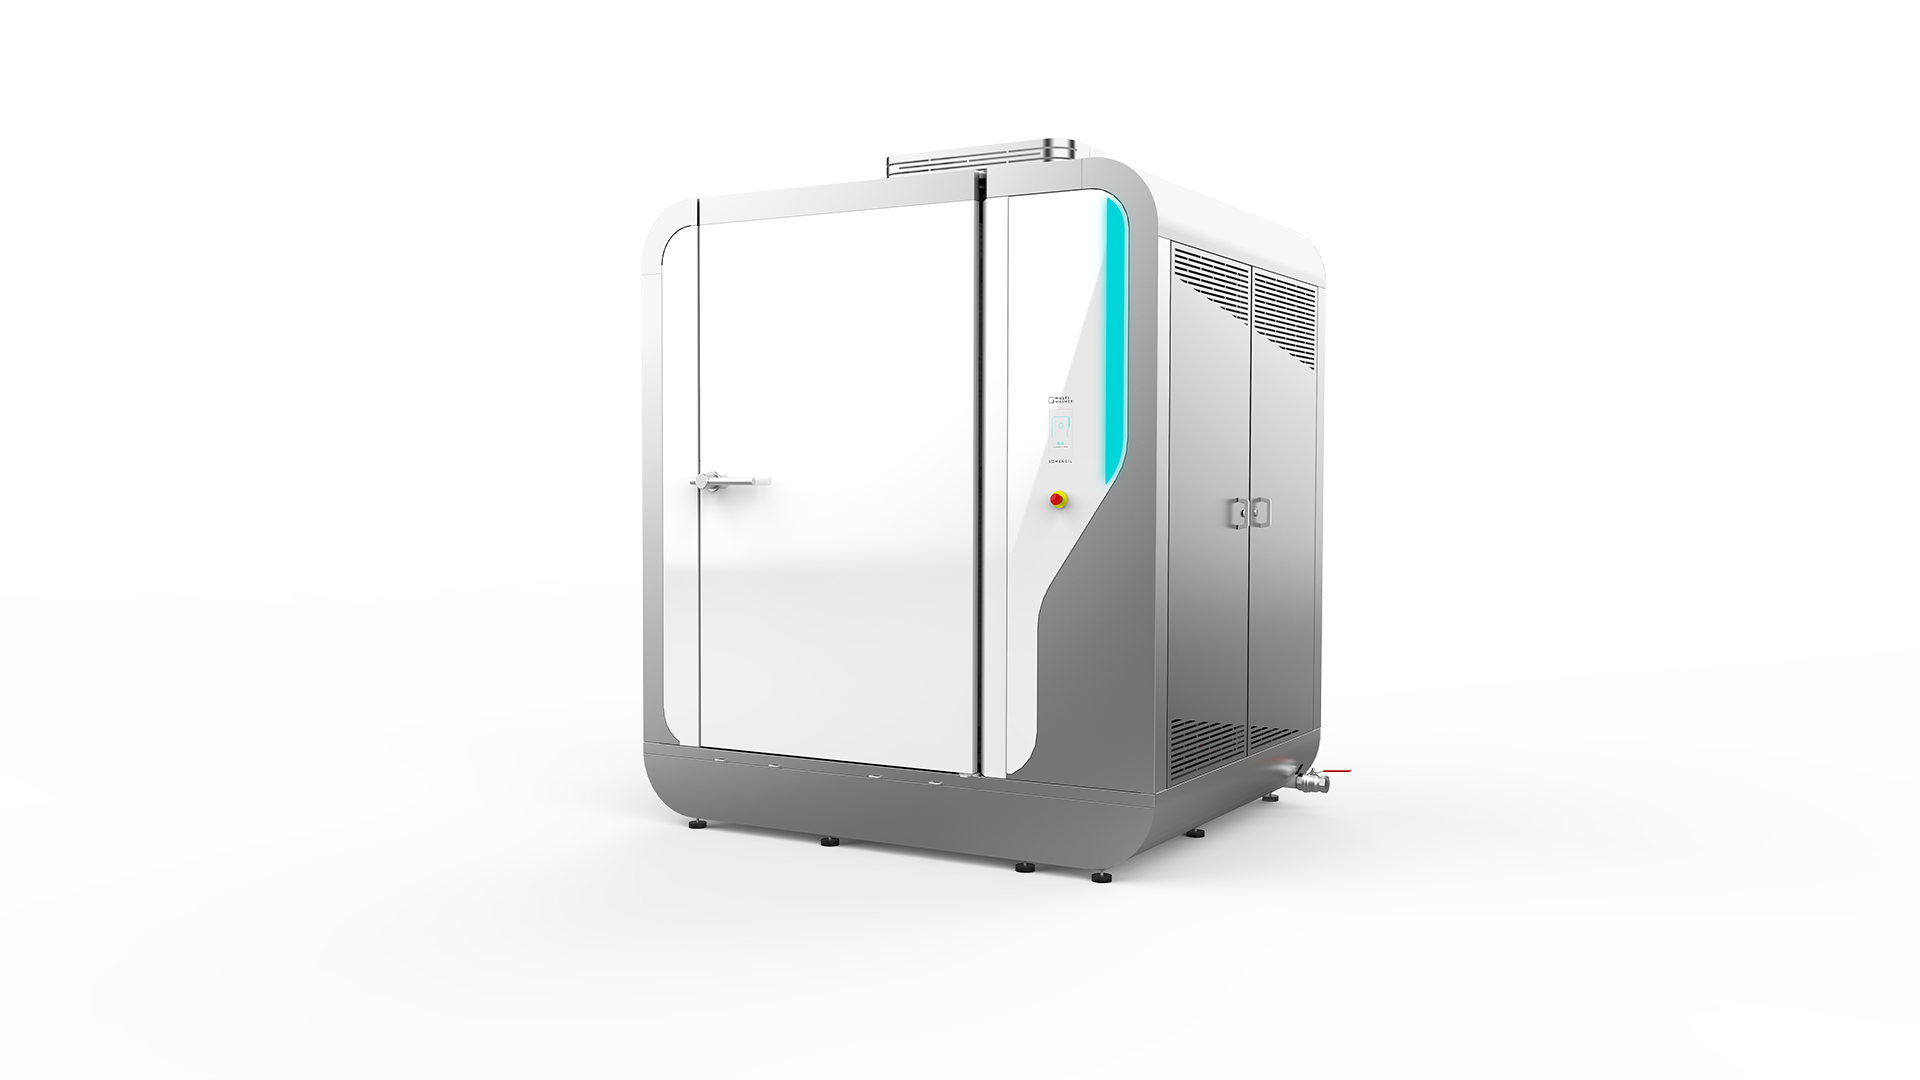
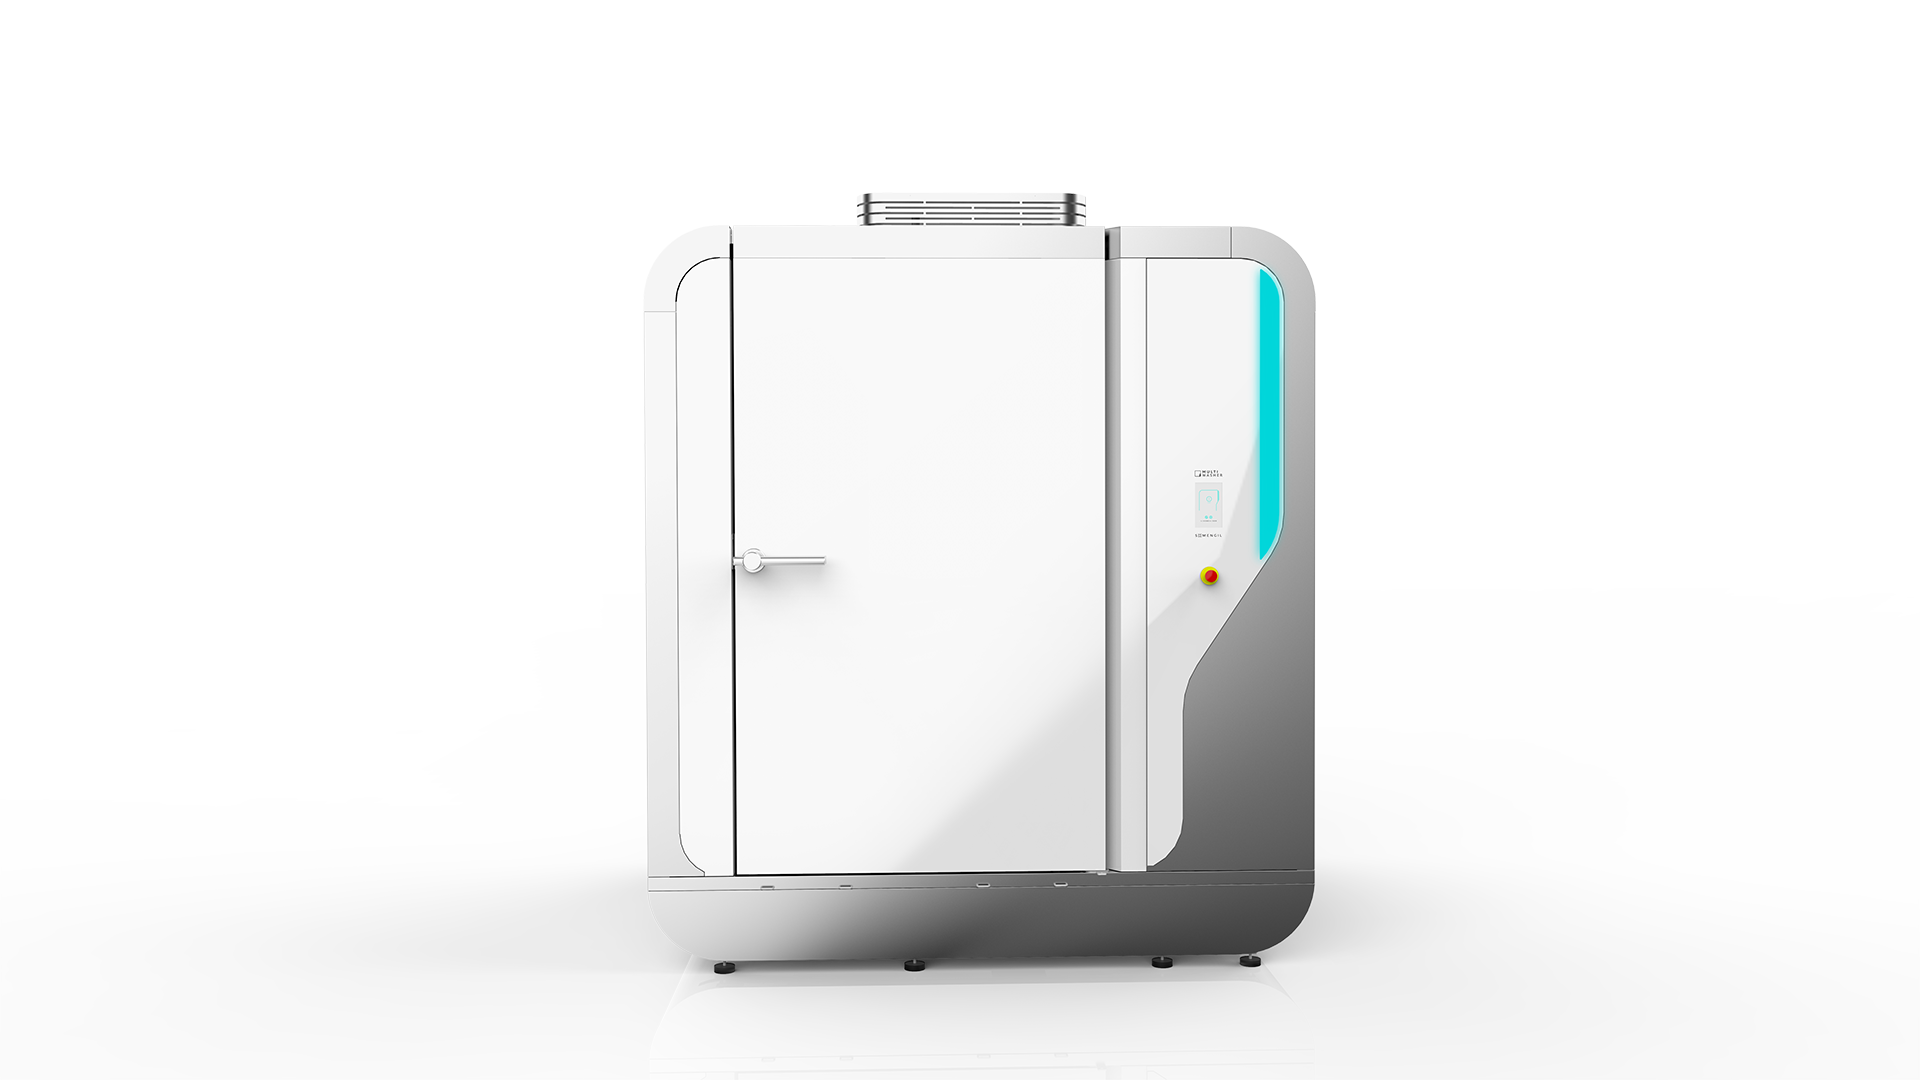
Plus qu’une préoccupation, l’amélioration permanente est une habitude et une manière d’être sur la ligne de front de votre secteur. Le diagramme d’Ishikawa est un outil largement utilisé en termes d’efforts d’amélioration permanente, mais il en existe de nombreux autres. Somengil aide les entreprises à atteindre des niveaux de qualité sans précédents, grâce à la MultiWasher, une machine à laver industrielle à hauts niveaux d’efficacité hydrique et électrique. Très polyvalente, la MultiWasher lave tous types d’ustensiles, d’outils ou de véhicules de transport, son design s’adaptant aux processus et son système étant facile à utiliser. Si les causes de fond détectées sur votre diagramme d’Ishikawa nécessitent des solutions innovantes et durables, n’hésitez pas à contacter nos spécialistes.
Tu pourrais aimer

Gestion / Articles
Comment choisir un chariot de transport : guide pour le secteur alimentaire
Déplacer des chargements rapidement et en toute sécurité n’est pas chose facile. Découvrez comment choisir le chariot de transport qui facilite l...
Publié dans 2022-07-28

Gestion / Articles
Les cuisines industrielles : 13 astuces pour les optimiser
Découvrez 13 astuces pour optimiser une cuisine industrielle et créer un environnement de travail plus fonctionnel, sécurisé, organisé et durable...
Publié dans 2022-08-16

Gestion / Articles
TQM : quand l’erreur est un atout
Le TQM ou Total Quality Management est la méthode où l’erreur est à la fois amie et ennemie. Découvrez ce que cela signifie et comment cela peut...
Publié dans 2022-11-24







 Portugal
 United Kingdom
 United States
 France
 Spain
Spain Germany
 Romania
 Italy
Italy Czech Republic
 Finland
 Hungary
 Slovakia
 Greece
 Lithuania
 South Korea
 Russia
 Saudi Arabia
 Poland
 Brasil
 Hebrew