Management / Articles
10 essential Quality KPIs (and how to improve them)
These are 10 essential quality KPIs every company should track, how to measure them, and what to do to improve them.

 12 minutes of reading
2023-03-09 19:11:48
- Quality KPIs show how well processes, products, and operations are performing against expected quality standards.
- Metrics such as rejection rate, cycle time, stock coverage, and on-time delivery provide a practical view of how quality behaves across production, logistics, and customer experience.
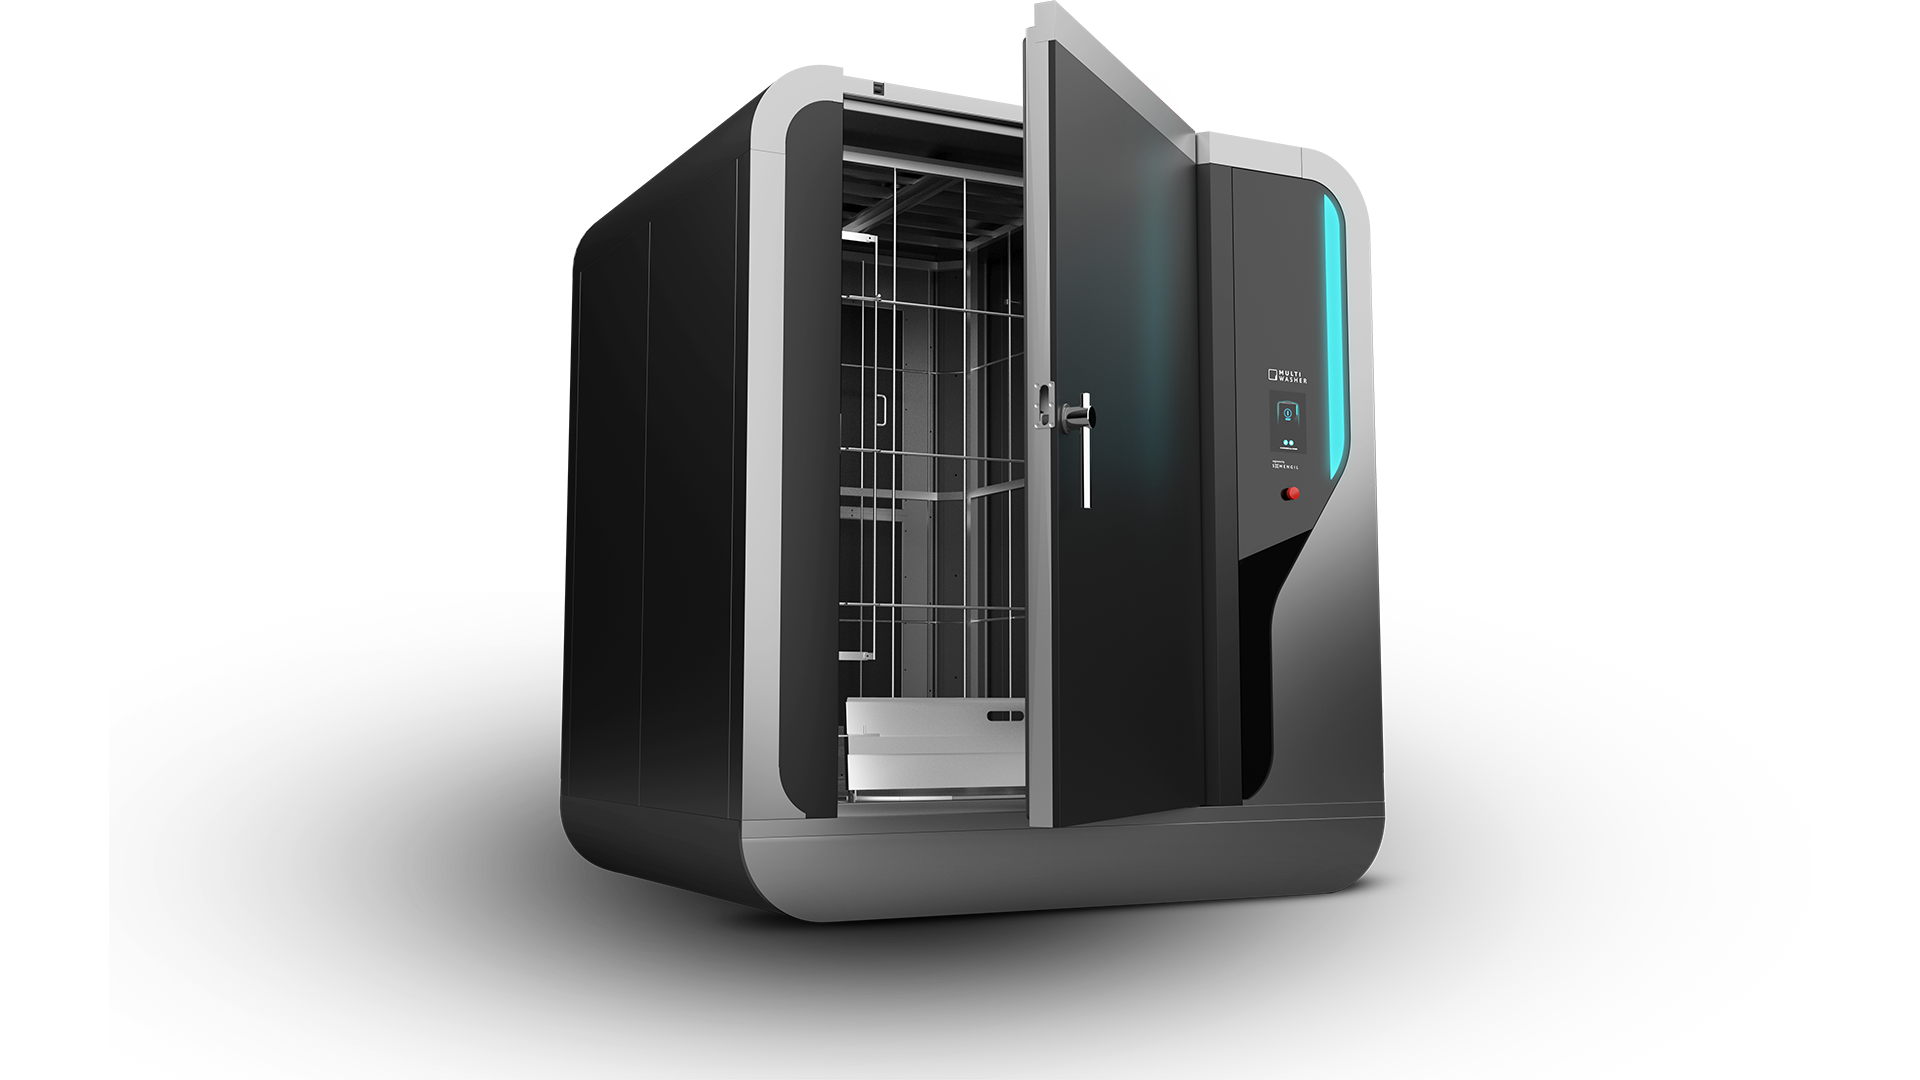
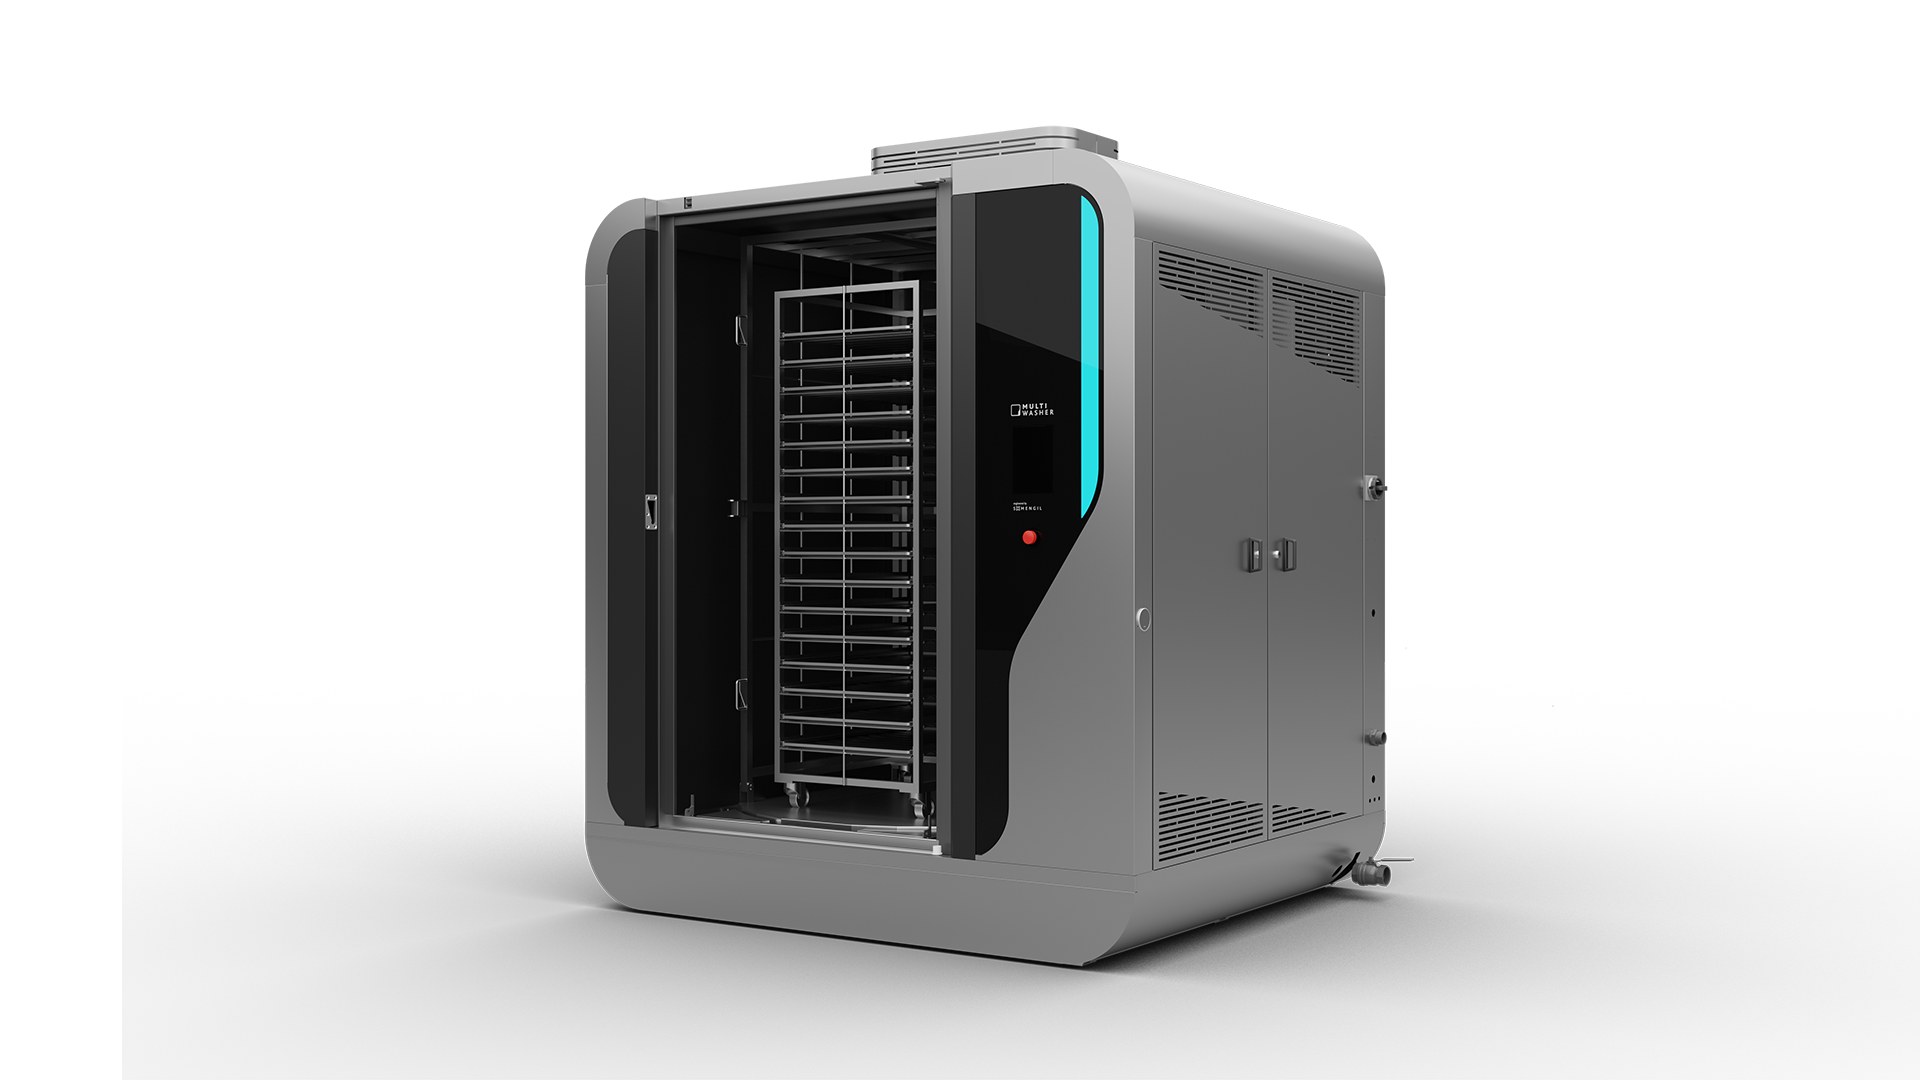
- MultiWasher supports more controlled and reliable washing processes, helping reduce variability and maintain consistent hygiene and operational standards.
At first, the warning signs seemed small. A few positive contamination tests. Some sanitation inconsistencies. Minor operational issues that, on paper, did not appear serious enough to stop production.
But inside Blue Bell Creameries, one of the largest ice cream manufacturers in the United States, those early signals would eventually escalate into a full-scale food safety crisis.
Between 2013 and 2015, internal tests repeatedly detected Listeria inside production facilities. According to FDA inspection reports, the company failed to properly investigate sanitation failures, monitor contamination risks consistently, and take sufficient corrective action. The situation culminated in a nationwide recall linked to illnesses and multiple deaths, forcing the company to halt production and severely damaging its reputation.
What makes cases like this particularly striking is that catastrophic failures rarely appear overnight. More often, they grow through small inefficiencies, recurring deviations, missed warning signs, and operational blind spots that remain unresolved over time.
This is exactly where quality KPIs become essential. They help businesses identify inconsistencies early, monitor performance continuously, and act before isolated issues become larger operational, financial, or reputational problems. And that’s exactly what we explore in this article.
1. Rejection rate
This quality KPI measures the percentage of products that are rejected during the production process due to quality issues. Rejection rate is calculated by dividing the number of rejected products by the total output. Among the most common causes of rejection in the food business are failures to ensure shelf life and differences in expected size, color, and taste. Packaging problems, such as the availability of the right size for each product, are also common. Identifying the main causes for each product family is the first step to eliminate them.
2. Product return rate
Product return rate measures the percentage of sold items that are later returned by customers. Although similar to the previous quality KPI, returns are far more serious, because problems are detected by customers – a testament to poor internal controls.
This quality indicator can be measured by dividing the number of returned products in a period of time after the sale, by the total amount sold. To improve the rate of product returns, it is important to understand the reasons for customer returns, identify the root causes, and define improvement actions. Some of the main causes for returns in the food industry are late deliveries, expired dates, mismatch between product and description, and shipping incorrect or damaged products.
3. Unplanned downtime
Unplanned downtime designates the periods in which production is stopped without prior planning of at least 24 hours. This quality indicator can be measured by summing the time a machine has been running at substandard speeds, experienced breaks, or unplanned maintenance stops during the length of a shift. Knowing this metric is important for assessing quality and maintenance costs.
One way to decrease unplanned downtime is through the 5S methodology, which allows you to optimize workstations to make the most used tools readily available. Thus, it is possible to ensure basic stability in the stations, detect problems faster, and even speed up interventions in case there are failures. Predictive maintenance, which anticipates interventions on equipment to prevent failures before they occur, also helps reduce the frequency and severity of unscheduled downtime. In addition, preparing employees to solve simple problems will reduce downtime in an area.
4. Cycle time
Cycle time answers the question: how frequently should a unit of a certain product be produced? For example, if a shift must produce 1000 units in 8 hours, the cycle time is approximately 2 minutes. This means that every 2 minutes a unit should come out with “good” quality. Achieve this target and you will be meeting demand. Fail to do so and risk missing deliveries.
This is a KPI for both quality and productivity, as it helps to set realistic goals and identify friction in the production process. Cycle time can be reduced (i.e., improved) by mapping out key processes, training employees, and upgrading machinery and equipment.
5. Stock coverage
Stock coverage refers to the number of days the company can operate without receiving further orders from its suppliers. For instance, a 8 days of stock mean that the company can work during this time only with what it already has in-house, at an average pace. It is recommended to have a minimum coverage level of a few days to deal with possible delivery failures. After a certain point, however, excess stock becomes a problem.
High stock levels – in raw materials, work in progress, or finished goods – are a defense against inefficiencies and failures in the production process. They are also a possible competitive constraint: a company with 16 days of stock coverage has more capital tied up in stock than another with just 8 days of stock, a sign of lack of efficiency and also of quality. That capital could be almost certainly be put to better use elsewhere.
On the other hand, high stock coverage can lead to new quality problems as materials deteriorate – such as breakdowns, obsolete and expired products. Stock coverage can be optimized by better forecasting requirements, improving internal processes to shorten production lead times, and by producing according to actual customer needs, rather than forecasts.
6. Net Promoter Score
Measuring process KPI is important but to know what customers really think, you can just ask. The Net Promoter Score, or NPS, is one of the most effective indicators for measuring customer experience. It all starts with a question: How likely are you to recommend the company to a friend or colleague? The answers are given on a scale of 0 to 10 and grouped as follows:
- Promoters (score of 9 to 10) are loyal enthusiasts who will continue to buy and recommend others, fueling growth.
- Passives (score of 7 to 8) are satisfied but unenthusiastic customers who are vulnerable to competitors’ offerings.
- Detractors (score of 0 to 6) are dissatisfied customers who can damage the brand and prevent a company from growing.
Subtracting the percentage of Detractors from that of Promoters produces the Net Promoter Score, which can range from a minimum of -100 (if every customer is a Detractor) to a maximum of 100 (if every customer is a Promoter).
This quality KPi is important to know if customers would repeat the purchase or recommend the product, obviously essential for the success of every business. The best way to calculate it is to go directly to the source by doing a good survey among current customers. For example, you could send an automatic email after each product delivery.
7. Overall Equipment Efficiency (OEE)
OEE measures how efficiently a production line is operating by combining availability, performance, and quality into a single KPI. It helps manufacturers understand how much productive time is actually being used effectively.
In food production, small stops, slower machine speeds, and quality defects can significantly impact output. Monitoring OEE helps identify hidden inefficiencies and recurring issues that affect productivity.
Improving OEE often involves reducing changeover times, strengthening preventive maintenance, and standardising production procedures.
8. First Pass Yield (FPY)
First Pass Yield measures the percentage of products that meet quality standards the first time they go through production, without requiring rework or corrections. It helps businesses understand how consistently processes are performed correctly from the start.
In the food industry, low FPY can lead to wasted ingredients, production delays, and higher operational costs. Common causes include unclear procedures, equipment instability, or insufficient process control.
Improving this KPI usually depends on better standardisation, employee training, and real-time quality monitoring.
9. On-Time Delivery Rate
On-Time Delivery Rate measures the percentage of orders delivered within the agreed timeframe. It reflects how reliable and coordinated the company’s operations and supply chain truly are.
For food businesses, delays can compromise freshness, disrupt retailers, and negatively affect customer trust. Poor delivery performance is often linked to production bottlenecks, forecasting errors, or logistics issues.
Companies can improve this KPI through better planning, stronger supplier coordination, and more accurate inventory management.
10. Complaint Resolution Time
Complaint Resolution Time measures how long it takes to investigate and resolve customer complaints. It is an important KPI for evaluating responsiveness and customer support efficiency.
In the food industry, slow responses can damage brand reputation and increase customer dissatisfaction, especially when quality or safety concerns are involved. Long resolution times may also reveal weak traceability or inefficient internal communication.
Faster resolutions usually depend on clear procedures, better access to production data, and stronger coordination between departments
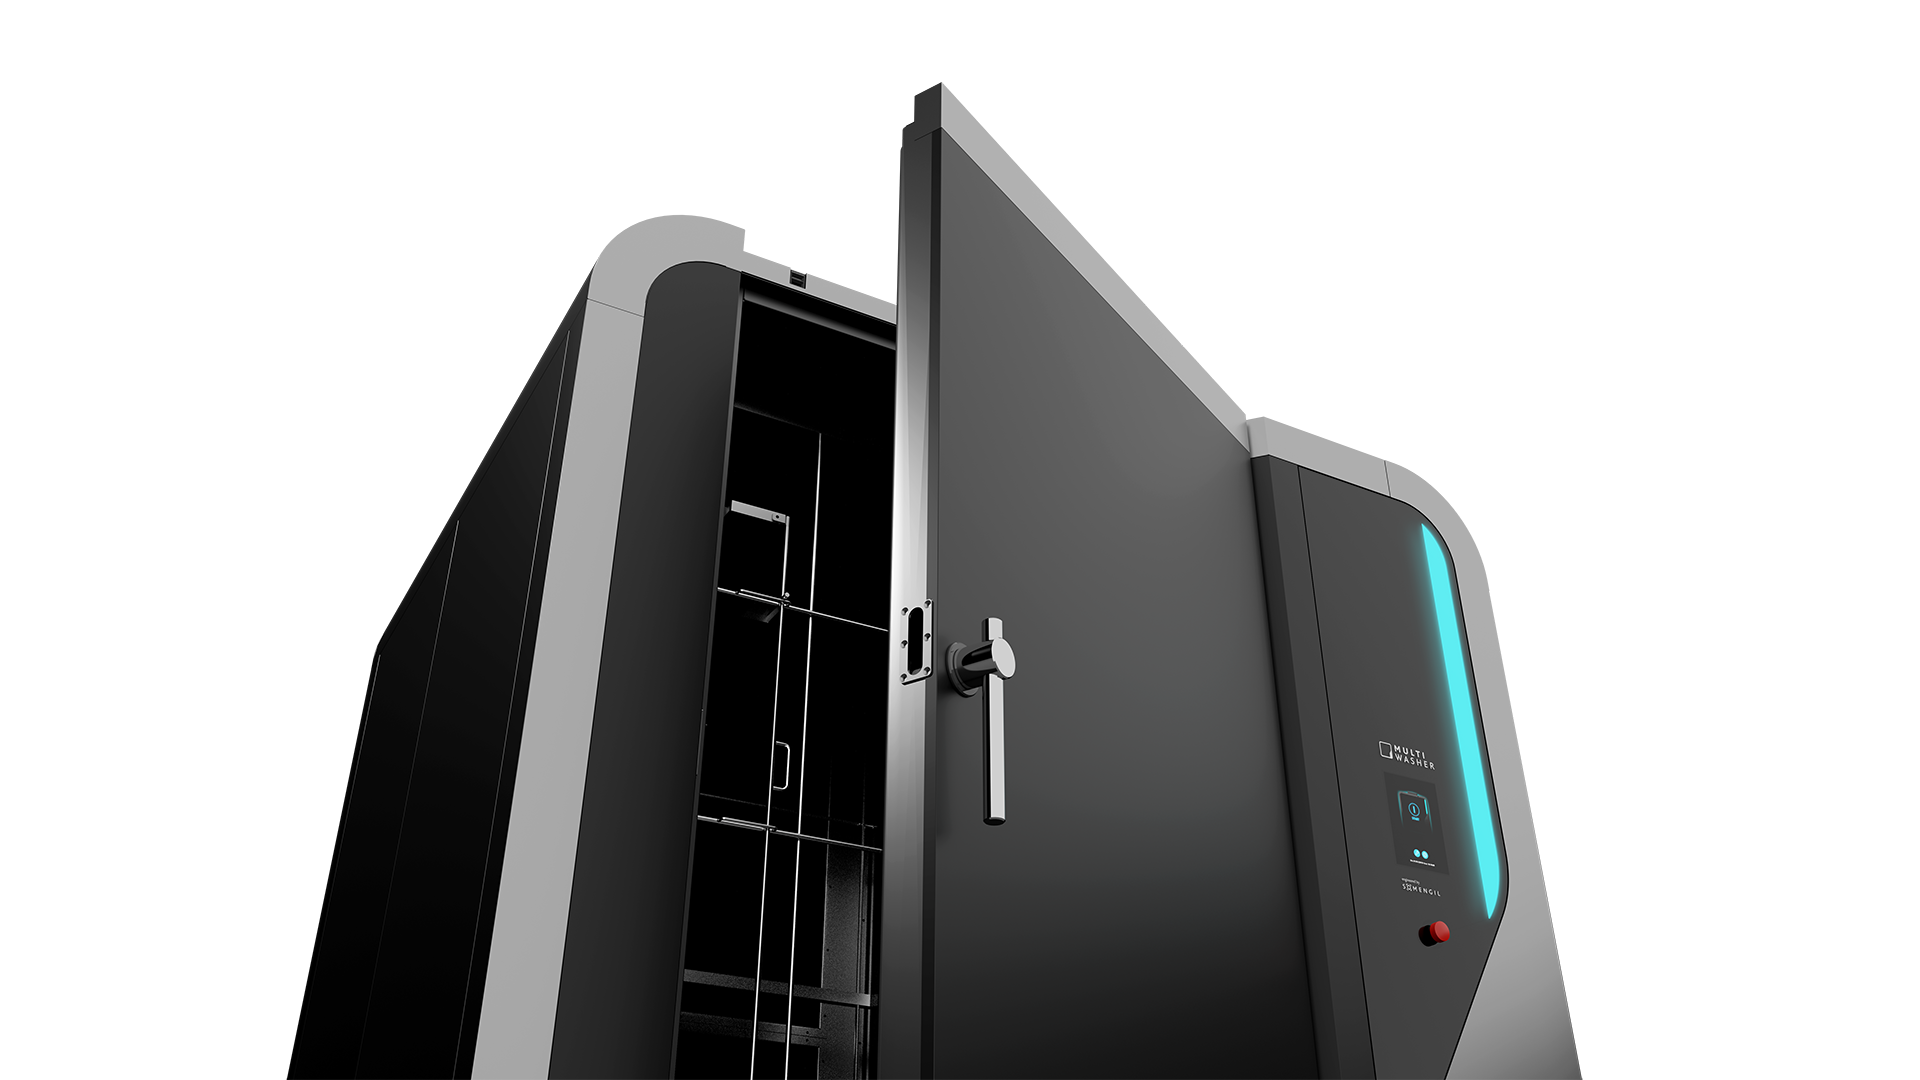
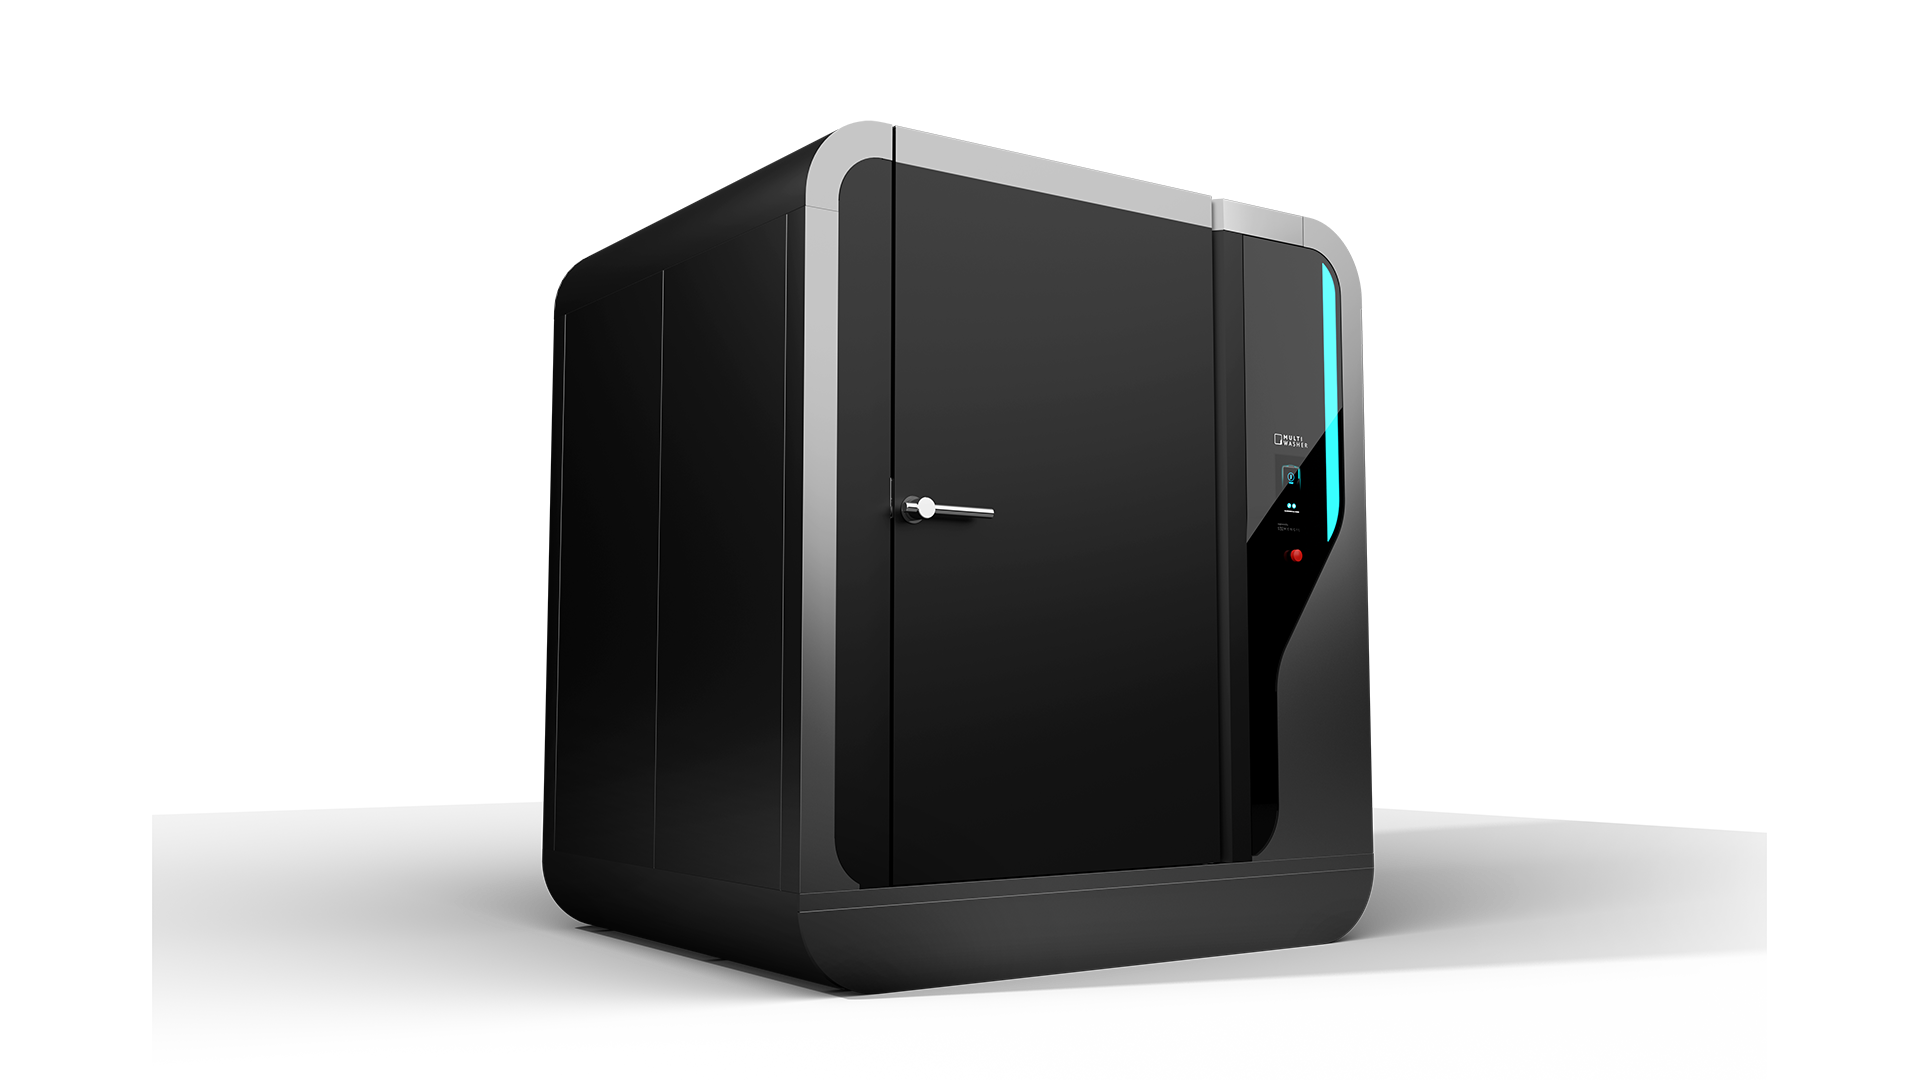
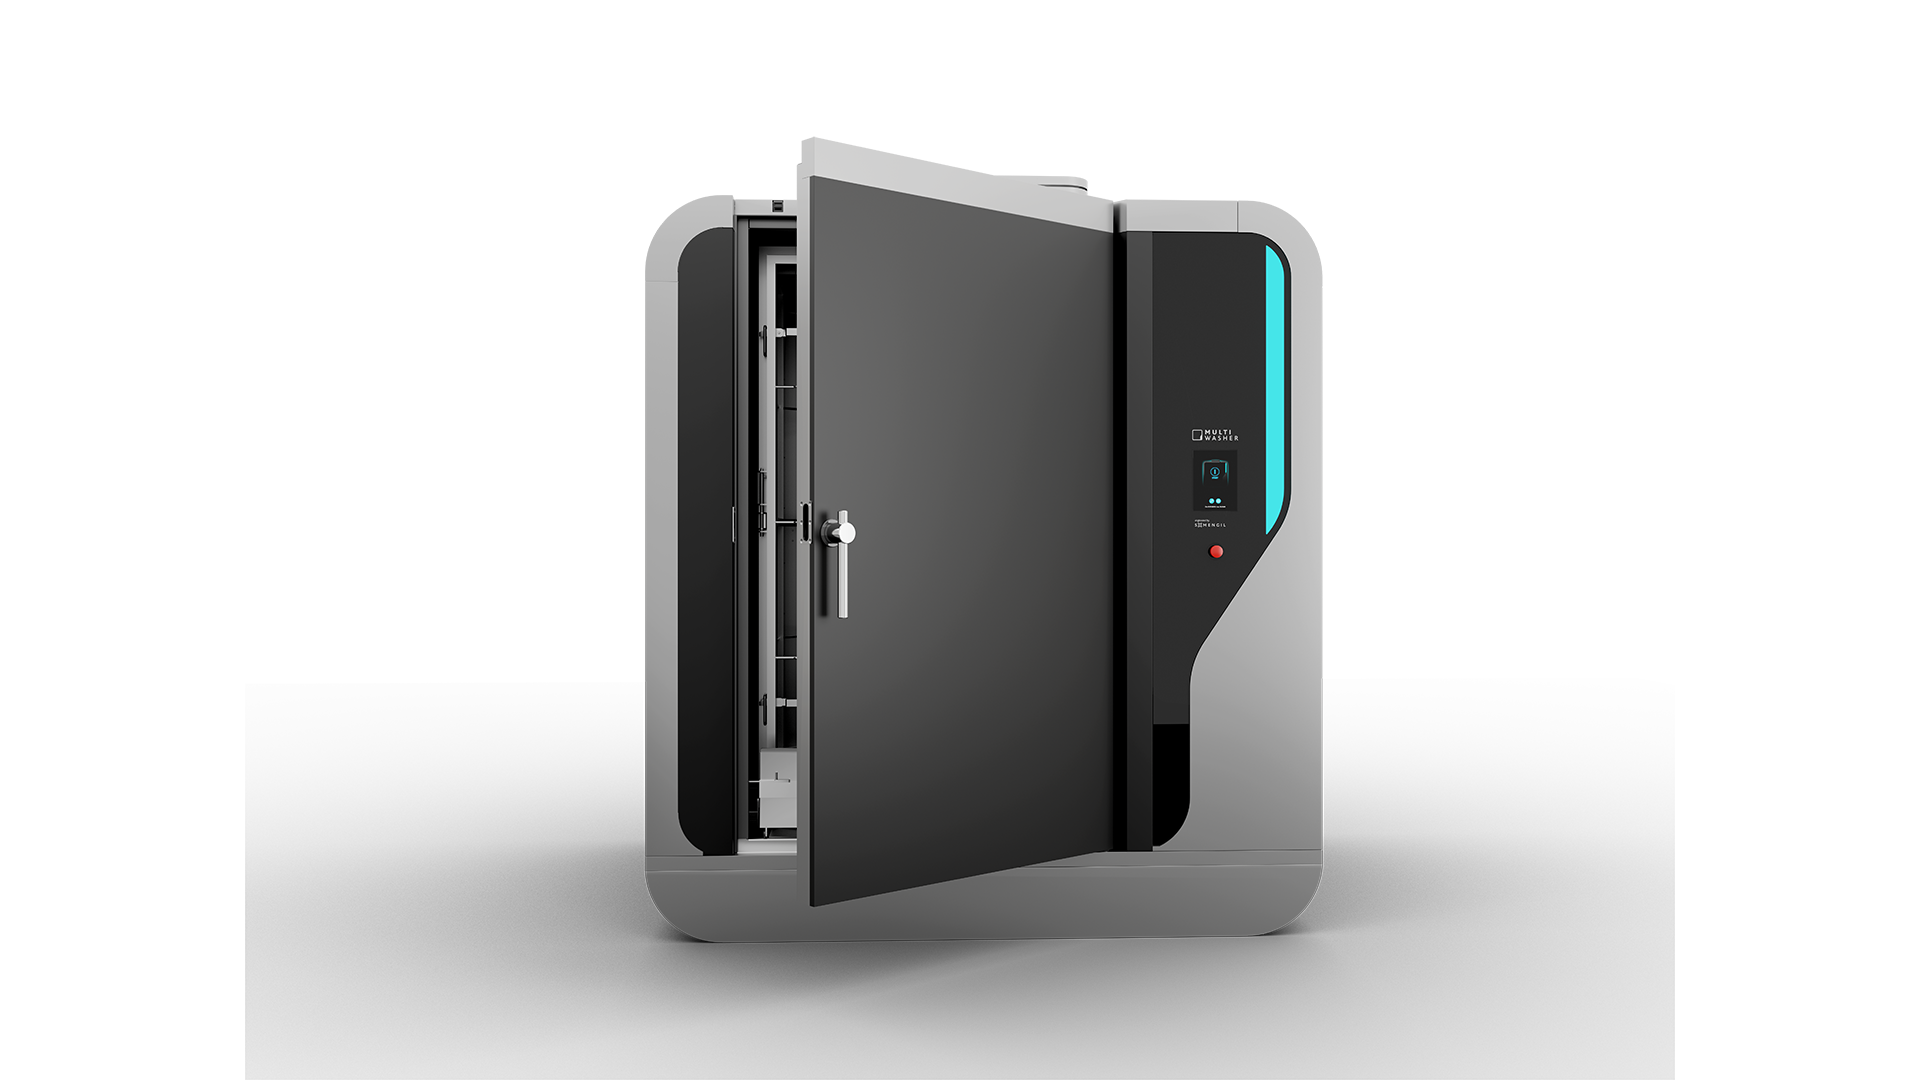
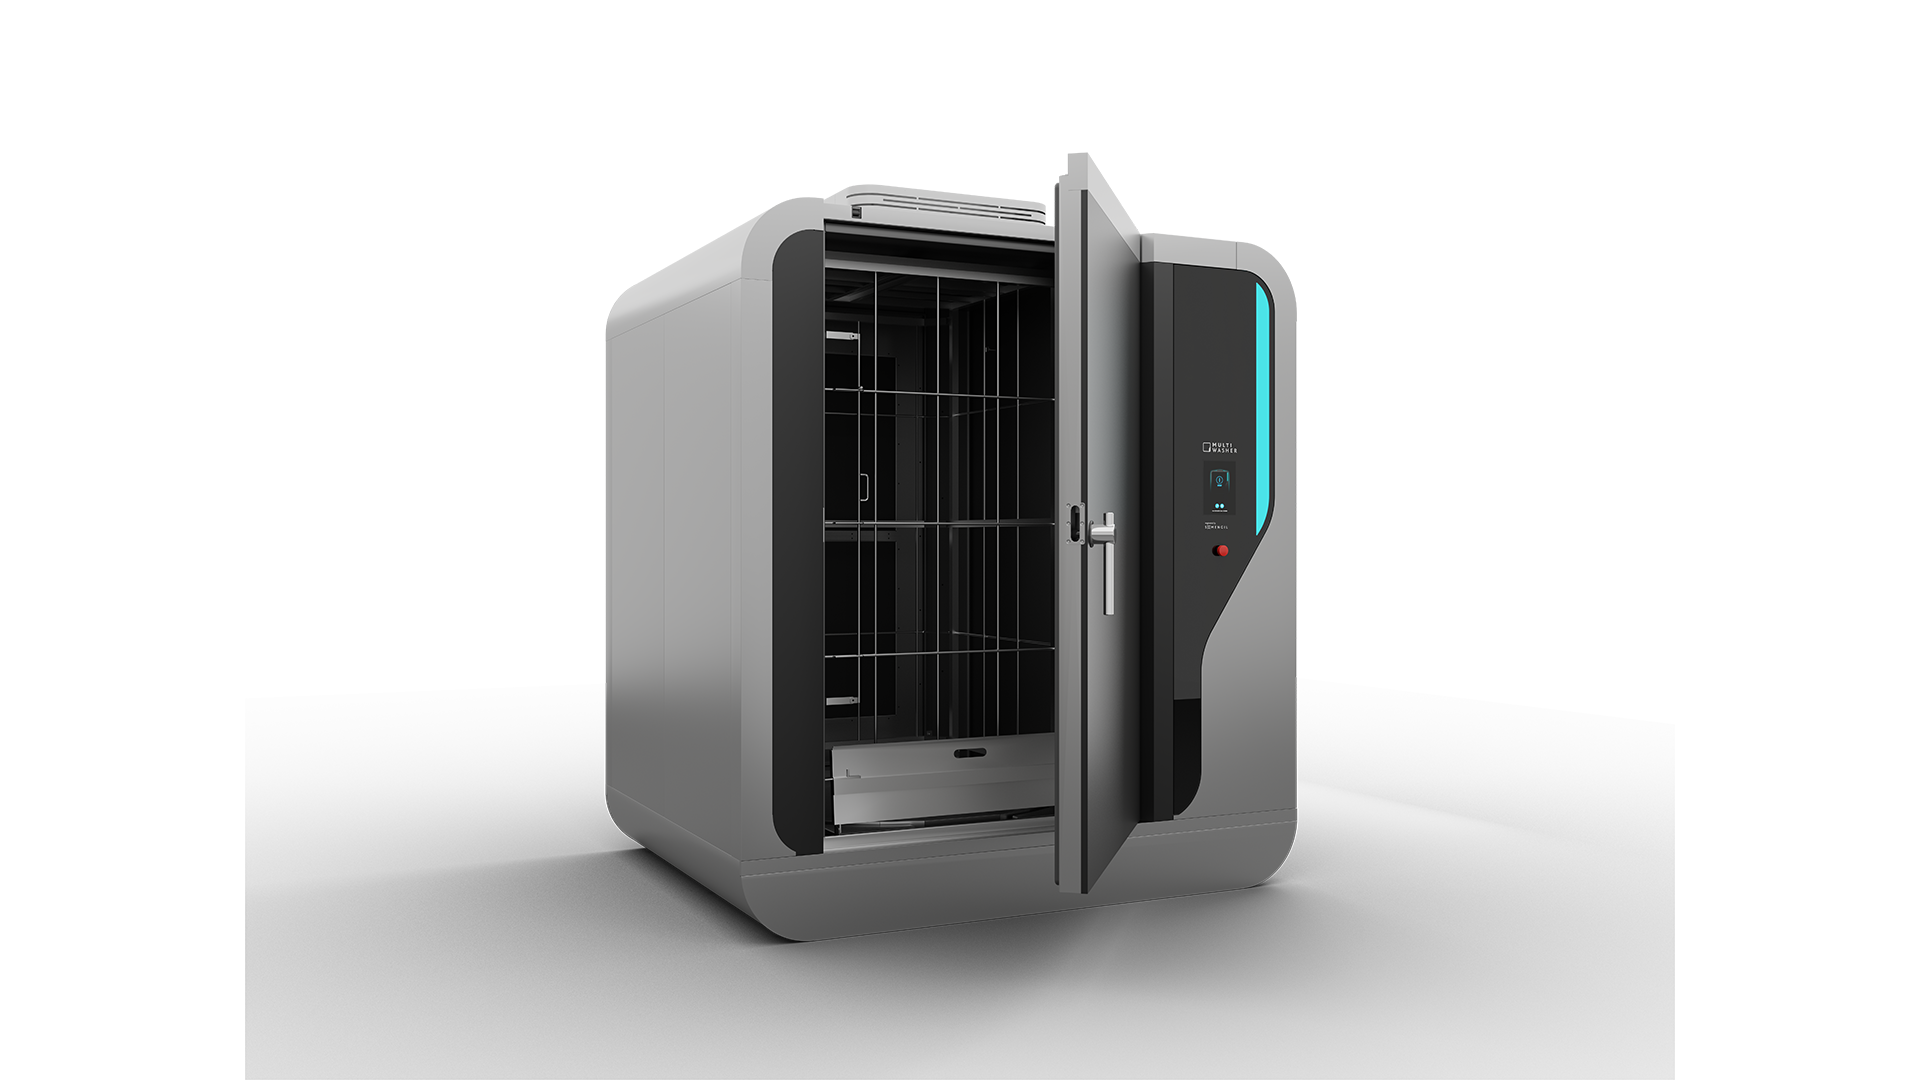
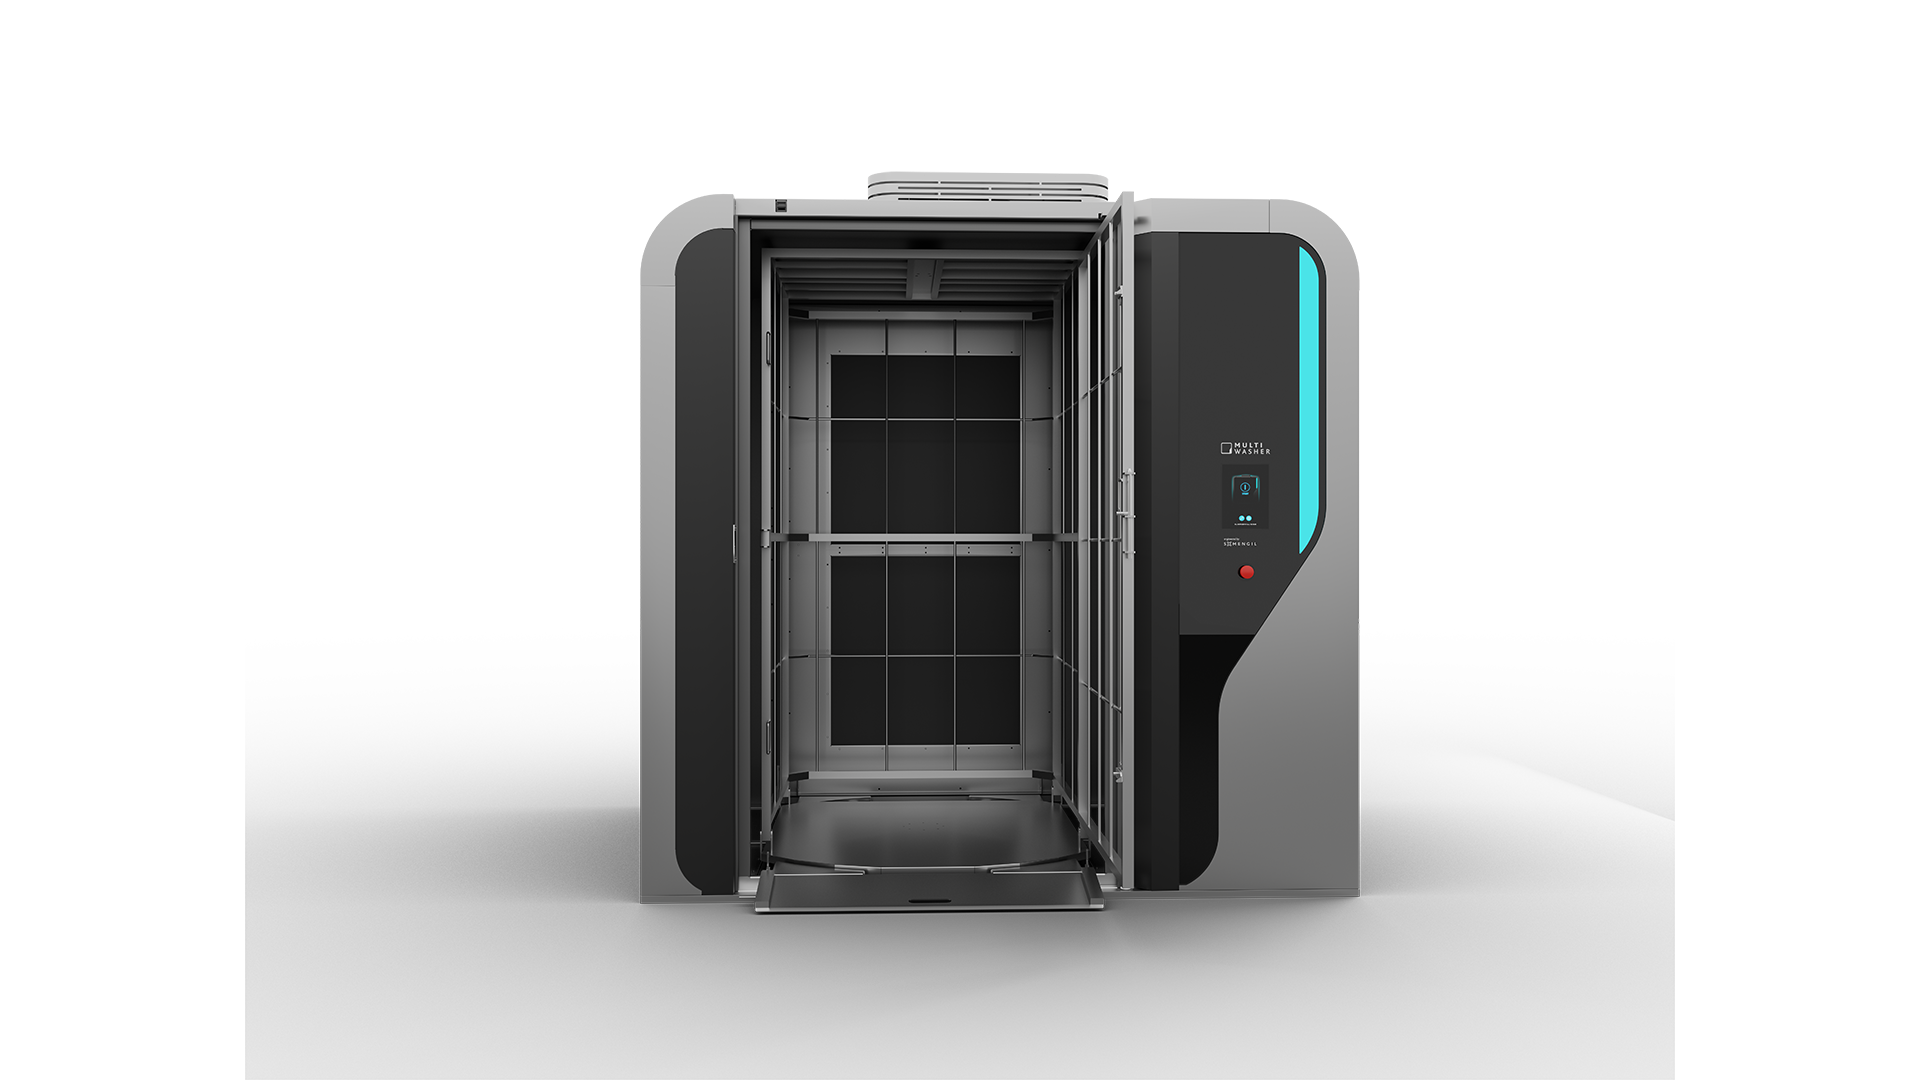
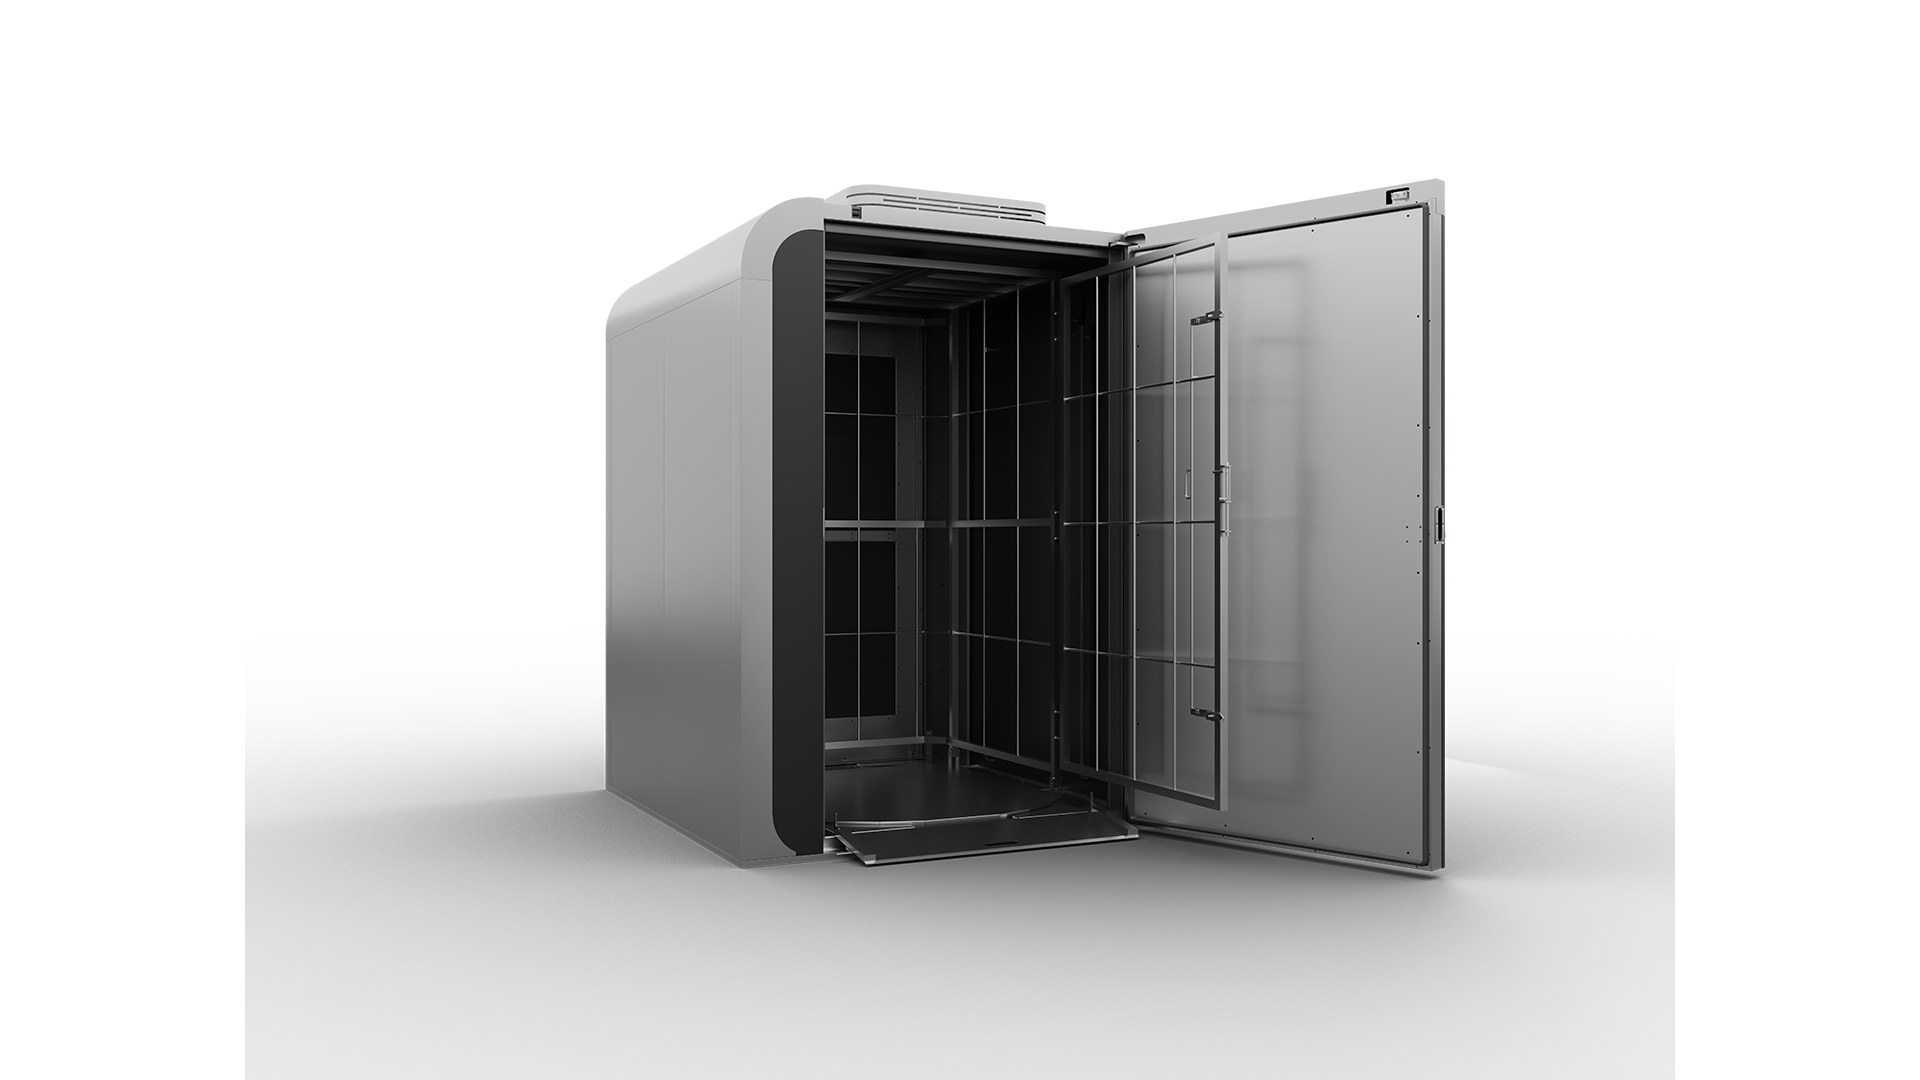
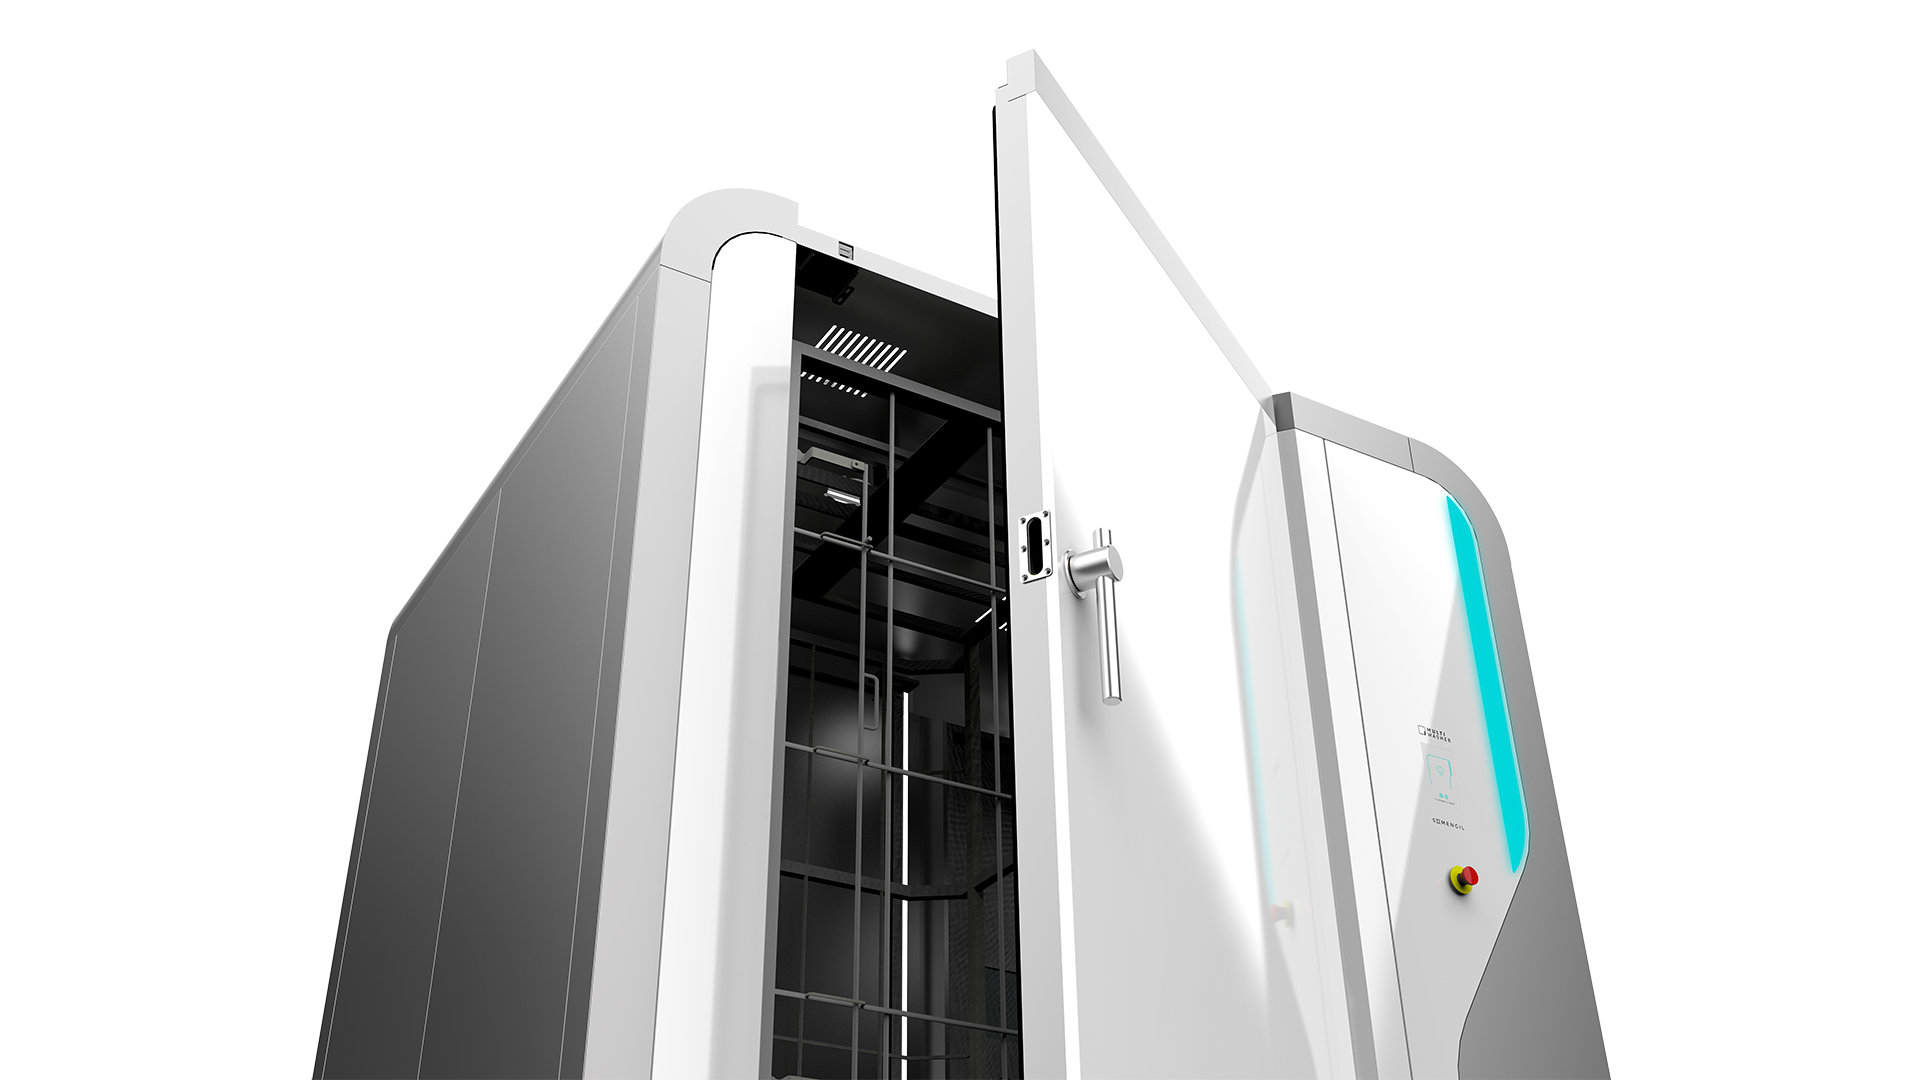
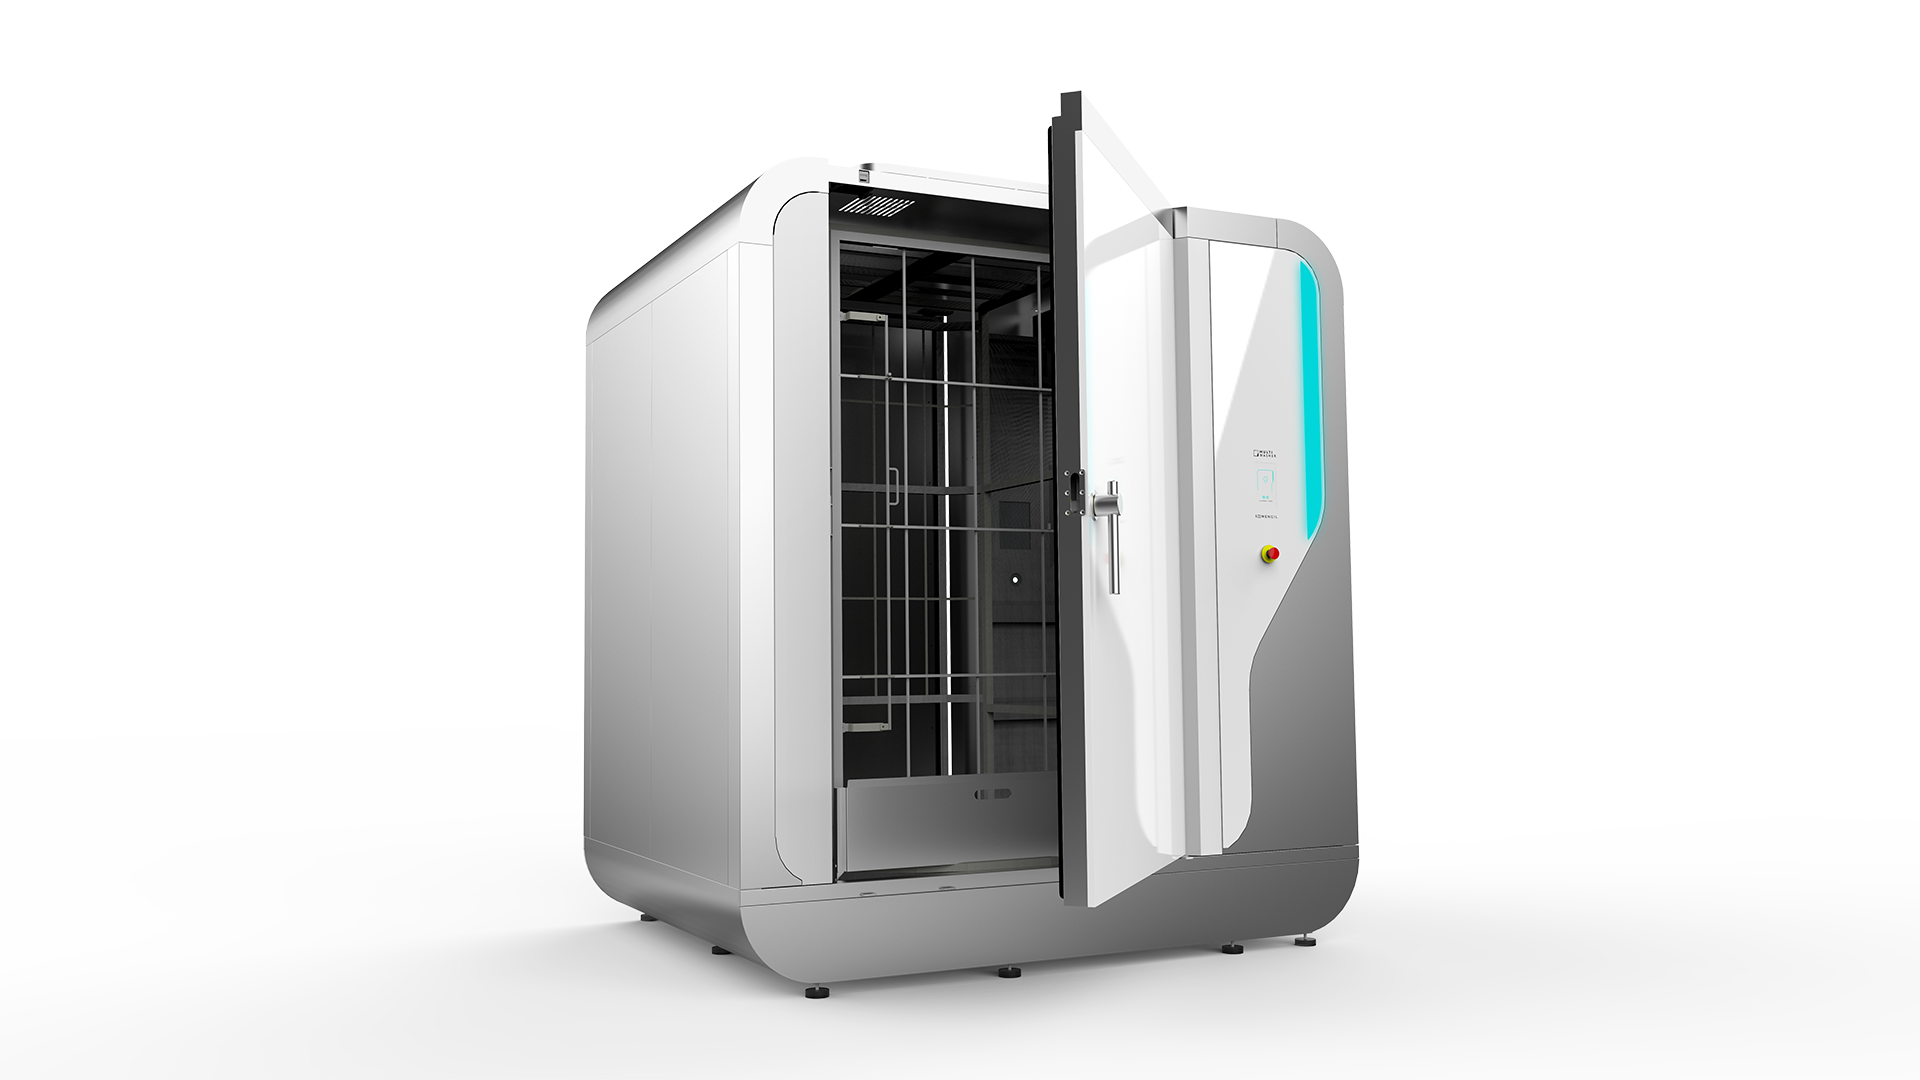
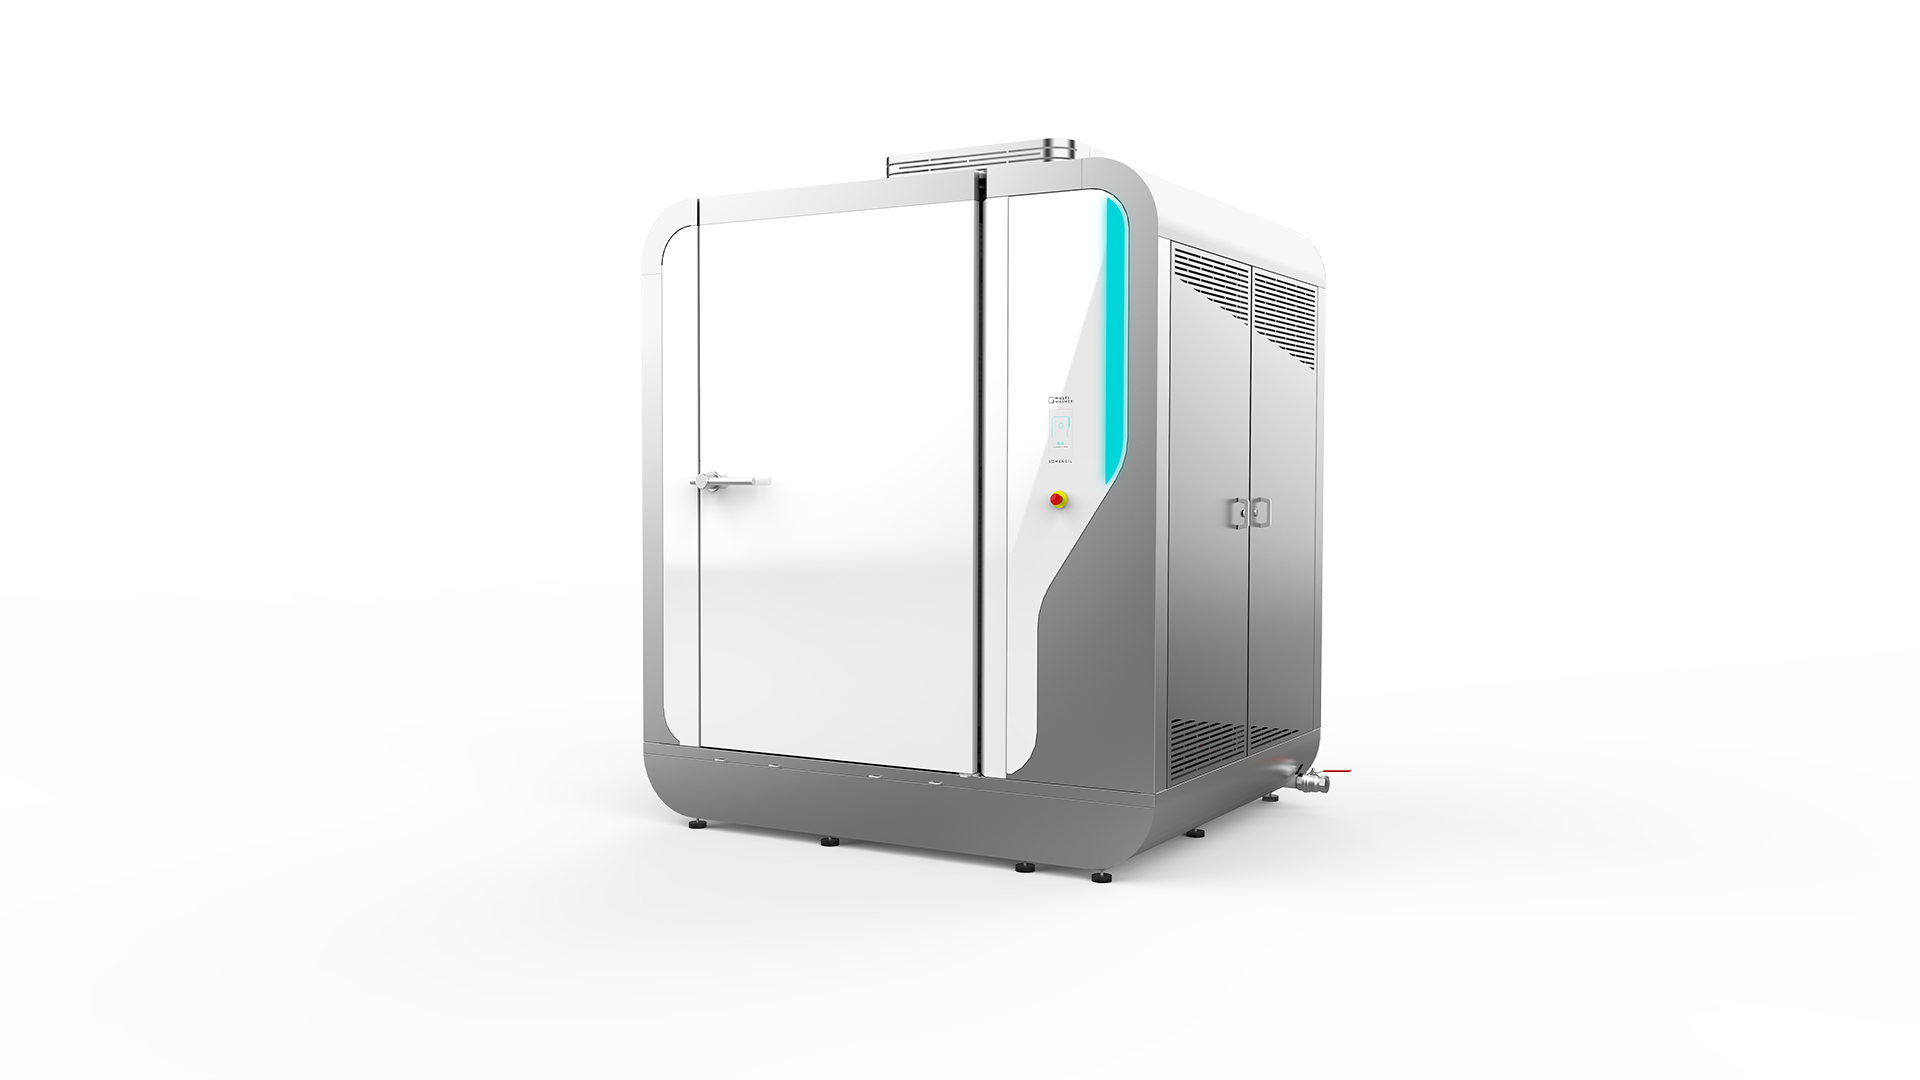
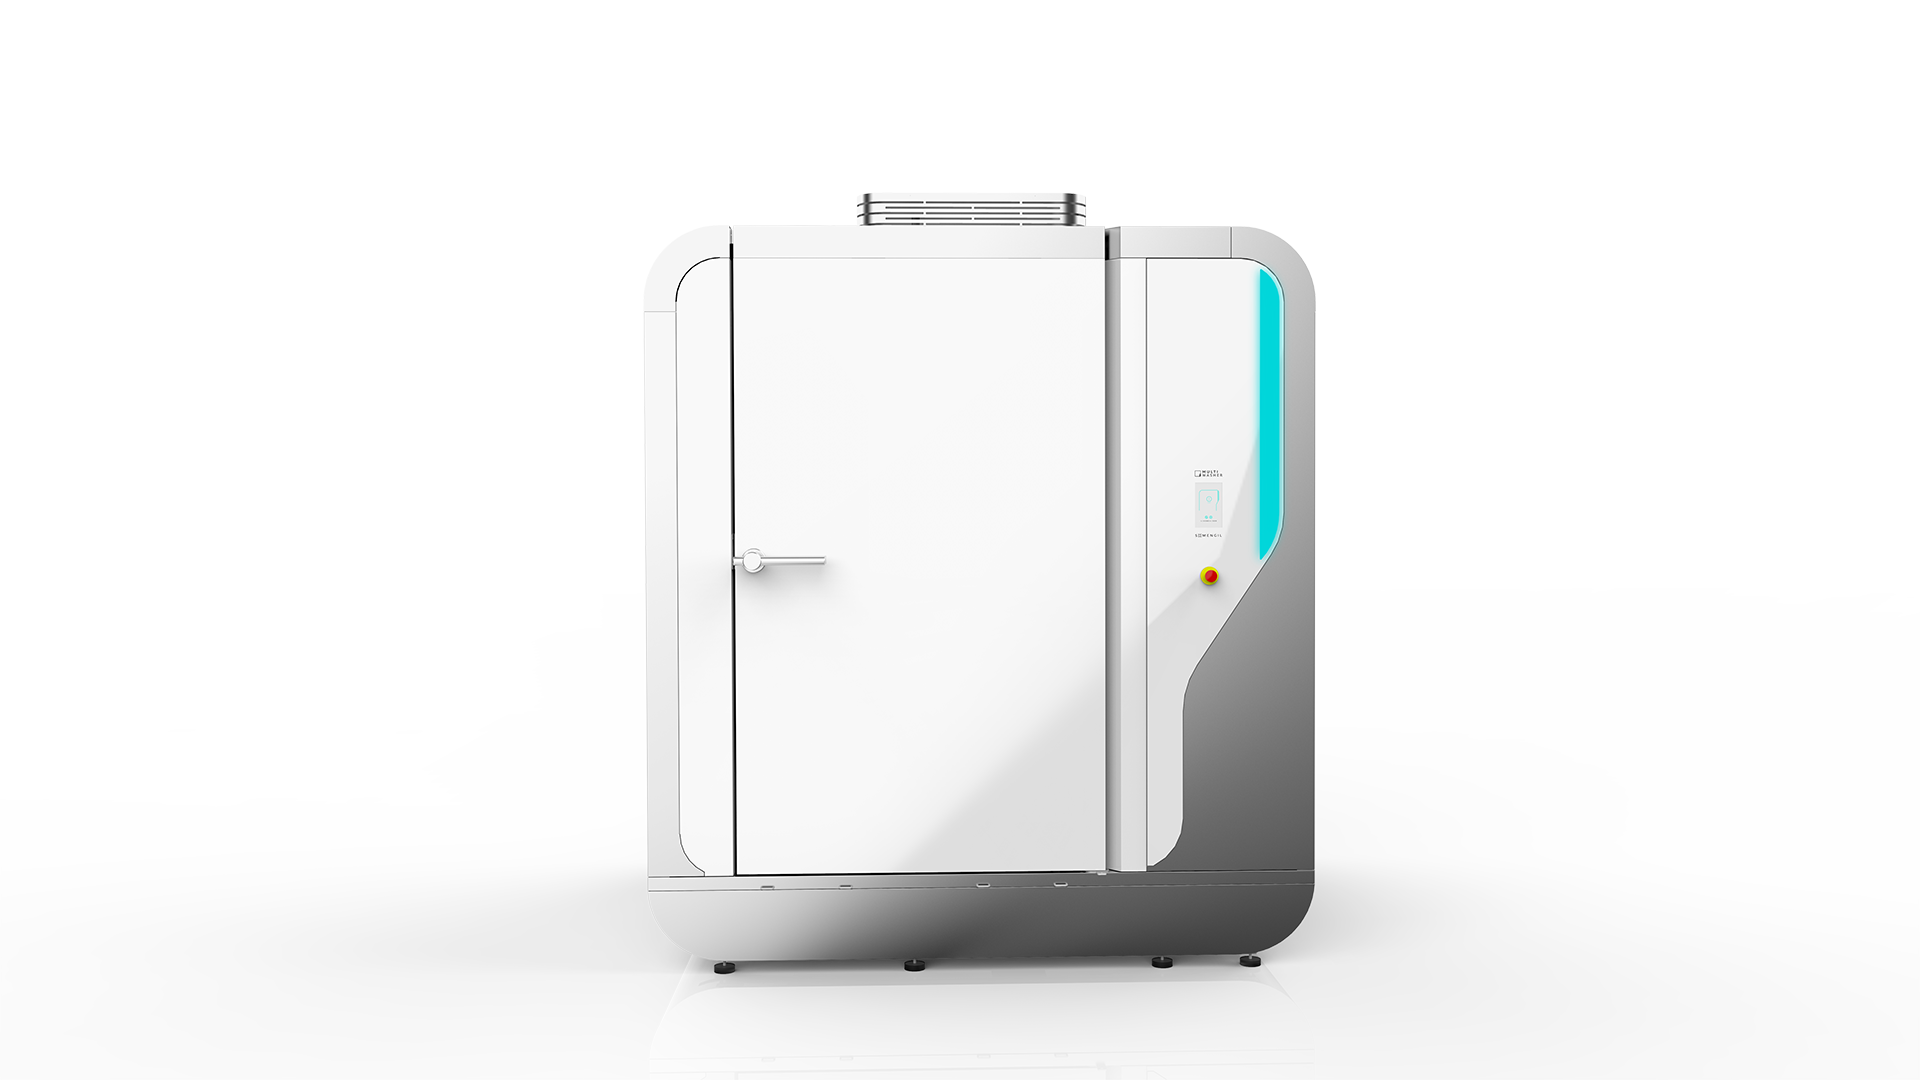
MultiWasher, the machine that keeps on improving
To promote efficient quality management, companies must rely on quality indicators to better understand the current state, predict failures, and make informed decisions.
Investing in quality also requires the most effective and efficient equipment. In the specific case of industrial washing, food companies can achieve those results with the MultiWasher. This state-of-the-art machine can sanitize any type of utensil, with sustainable consumption of water, detergent, and energy. See the MultiWasher in action for yourself to know how it can elevate the quality of your washing processes.

MÁRIO FRAGOSO
Quality Manager | Somengil
Mário Fragoso is responsible for the Integrated Quality and Environmental Management System. With a focus on continuous improvement and prevention, he works across departments with teams and partners to ensure high standards of execution, control, and compliance, thereby strengthening confidence in and the credibility of the equipment developed by Somengil.
You may also like

Management / Articles
Six Sigma: Searching for the Perfect Process
Achieving (near) 100% accuracy is the goal of the Six Sigma method. Find out what it is and how to apply it.
Posted in 2022-12-29

Management / Articles
Supply chain analytics explained: what it is and why it matters
How to leverage Supply chain Analytics to plan and implement a more reliable process.
Posted in 2024-07-03

Management / Articles
“The machine that changed the world is over 160 years old!”
We spoke with José Camarinha, Export Manager at Somengil, about the importance of the washing machine and how it continues to shape society 160 y...
Posted in 2022-02-10


 Portugal
 United Kingdom
 United States
 France
 Spain
Spain Germany
 Romania
 Italy
Italy Czech Republic
 Finland
 Hungary
 Slovakia
 Greece
 Lithuania
 South Korea
 Russia
 Saudi Arabia
 Poland
 Brasil
 Hebrew